| Full name: IgLON family member 5 | Alias Symbol: LOC402665 | ||
| Type: protein-coding gene | Cytoband: 19q13.41 | ||
| Entrez ID: 402665 | HGNC ID: HGNC:34550 | Ensembl Gene: ENSG00000142549 | OMIM ID: |
Screen Evidence:
| |||
Expression of IGLON5:
| Dataset | Gene | EntrezID | Probe | Log2FC | Adj.pValue | Expression |
|---|---|---|---|---|---|---|
| GSE17351 | IGLON5 | 402665 | 244694_at | -0.1070 | 0.6399 | |
| GSE26886 | IGLON5 | 402665 | 244694_at | 0.0639 | 0.6058 | |
| GSE45670 | IGLON5 | 402665 | 244694_at | -0.0318 | 0.8034 | |
| GSE53622 | IGLON5 | 402665 | 52127 | 0.1927 | 0.0363 | |
| GSE53624 | IGLON5 | 402665 | 52127 | -0.0531 | 0.5740 | |
| GSE63941 | IGLON5 | 402665 | 244694_at | 0.1260 | 0.4365 | |
| GSE77861 | IGLON5 | 402665 | 244694_at | -0.0989 | 0.4931 | |
| GSE97050 | IGLON5 | 402665 | A_24_P271149 | -0.2650 | 0.2272 | |
| SRP064894 | IGLON5 | 402665 | RNAseq | -2.0324 | 0.0000 | |
| SRP133303 | IGLON5 | 402665 | RNAseq | -1.3393 | 0.0002 | |
| SRP159526 | IGLON5 | 402665 | RNAseq | -0.9061 | 0.2014 | |
| SRP219564 | IGLON5 | 402665 | RNAseq | -3.0028 | 0.0004 | |
| TCGA | IGLON5 | 402665 | RNAseq | 0.5120 | 0.1040 |
Upregulated datasets: 0; Downregulated datasets: 3.
Survival by IGLON5 expression:
 | 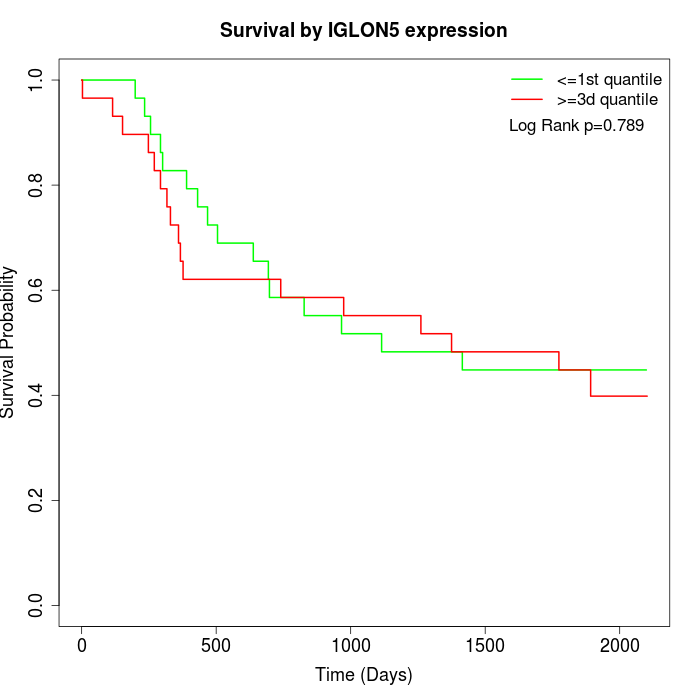 | 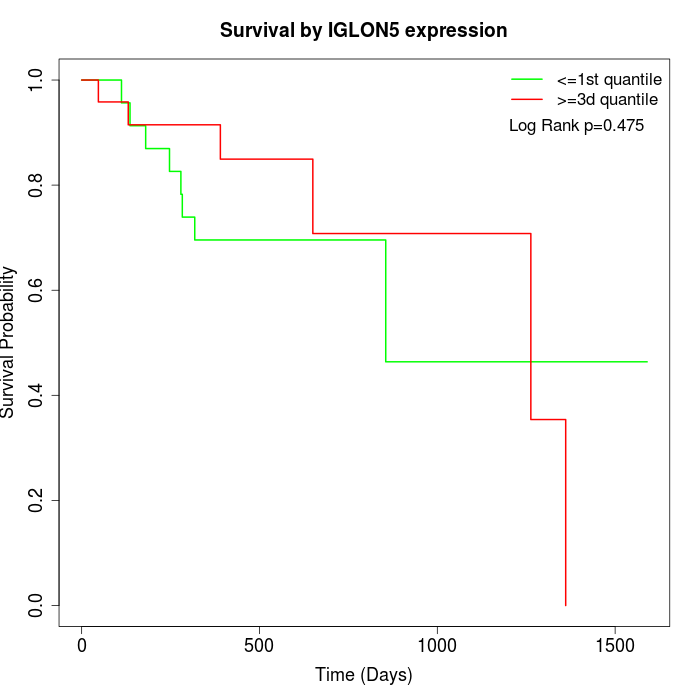 |
| GSE53622 | GSE53624 | TCGA |
Note: Click image to view full size file.
Copy number change of IGLON5:
| Dataset | Gene | EntrezID | Gain | Loss | Normal | Detail |
|---|---|---|---|---|---|---|
| GSE15526 | IGLON5 | 402665 | 3 | 4 | 23 | |
| GSE20123 | IGLON5 | 402665 | 3 | 3 | 24 | |
| GSE43470 | IGLON5 | 402665 | 3 | 12 | 28 | |
| GSE46452 | IGLON5 | 402665 | 45 | 1 | 13 | |
| GSE47630 | IGLON5 | 402665 | 9 | 6 | 25 | |
| GSE54993 | IGLON5 | 402665 | 17 | 4 | 49 | |
| GSE54994 | IGLON5 | 402665 | 4 | 14 | 35 | |
| GSE60625 | IGLON5 | 402665 | 9 | 0 | 2 | |
| GSE74703 | IGLON5 | 402665 | 3 | 8 | 25 | |
| GSE74704 | IGLON5 | 402665 | 3 | 1 | 16 | |
| TCGA | IGLON5 | 402665 | 14 | 19 | 63 |
Total number of gains: 113; Total number of losses: 72; Total Number of normals: 303.
Somatic mutations of IGLON5:
Generating mutation plots.
Highly correlated genes for IGLON5:
Showing top 20/231 corelated genes with mean PCC>0.5.
| Gene1 | Gene2 | Mean PCC | Num. Datasets | Num. PCC<0 | Num. PCC>0.5 |
|---|---|---|---|---|---|
| IGLON5 | PRG3 | 0.810199 | 3 | 0 | 3 |
| IGLON5 | YY2 | 0.794466 | 3 | 0 | 3 |
| IGLON5 | CRYBB3 | 0.787531 | 3 | 0 | 3 |
| IGLON5 | LY6H | 0.764532 | 3 | 0 | 3 |
| IGLON5 | SPRED3 | 0.751069 | 3 | 0 | 3 |
| IGLON5 | ZNF763 | 0.748212 | 3 | 0 | 3 |
| IGLON5 | SHROOM4 | 0.742986 | 3 | 0 | 3 |
| IGLON5 | OR2B11 | 0.735757 | 3 | 0 | 3 |
| IGLON5 | MYO1C | 0.726239 | 3 | 0 | 3 |
| IGLON5 | TBX21 | 0.719137 | 3 | 0 | 3 |
| IGLON5 | VMO1 | 0.71751 | 3 | 0 | 3 |
| IGLON5 | PROCA1 | 0.715445 | 4 | 0 | 4 |
| IGLON5 | RASL10B | 0.710477 | 4 | 0 | 4 |
| IGLON5 | OTOG | 0.710248 | 3 | 0 | 3 |
| IGLON5 | BBC3 | 0.710152 | 3 | 0 | 3 |
| IGLON5 | ADH6 | 0.709252 | 3 | 0 | 3 |
| IGLON5 | CHST10 | 0.708612 | 3 | 0 | 3 |
| IGLON5 | TOR2A | 0.706462 | 3 | 0 | 3 |
| IGLON5 | REG3A | 0.706347 | 3 | 0 | 3 |
| IGLON5 | OR10AD1 | 0.705431 | 3 | 0 | 3 |
For details and further investigation, click here