| Full name: vitelline membrane outer layer 1 homolog | Alias Symbol: | ||
| Type: protein-coding gene | Cytoband: 17p13.2 | ||
| Entrez ID: 284013 | HGNC ID: HGNC:30387 | Ensembl Gene: ENSG00000182853 | OMIM ID: |
Expression of VMO1:
| Dataset | Gene | EntrezID | Probe | Log2FC | Adj.pValue | Expression |
|---|---|---|---|---|---|---|
| GSE17351 | VMO1 | 284013 | 241894_at | 0.1239 | 0.7258 | |
| GSE26886 | VMO1 | 284013 | 235751_s_at | 0.3485 | 0.1195 | |
| GSE45670 | VMO1 | 284013 | 241894_at | 0.1081 | 0.3052 | |
| GSE53622 | VMO1 | 284013 | 109625 | -0.0013 | 0.9927 | |
| GSE53624 | VMO1 | 284013 | 109625 | -0.1033 | 0.4225 | |
| GSE63941 | VMO1 | 284013 | 235751_s_at | -0.0390 | 0.9436 | |
| GSE77861 | VMO1 | 284013 | 241894_at | -0.1317 | 0.3080 | |
| GSE97050 | VMO1 | 284013 | A_23_P55356 | -0.3423 | 0.6253 | |
| SRP064894 | VMO1 | 284013 | RNAseq | 1.4831 | 0.0001 | |
| SRP133303 | VMO1 | 284013 | RNAseq | 0.7486 | 0.0415 | |
| SRP159526 | VMO1 | 284013 | RNAseq | 0.5423 | 0.1606 | |
| SRP219564 | VMO1 | 284013 | RNAseq | 1.6207 | 0.0016 | |
| TCGA | VMO1 | 284013 | RNAseq | 0.9255 | 0.0001 |
Upregulated datasets: 2; Downregulated datasets: 0.
Survival by VMO1 expression:
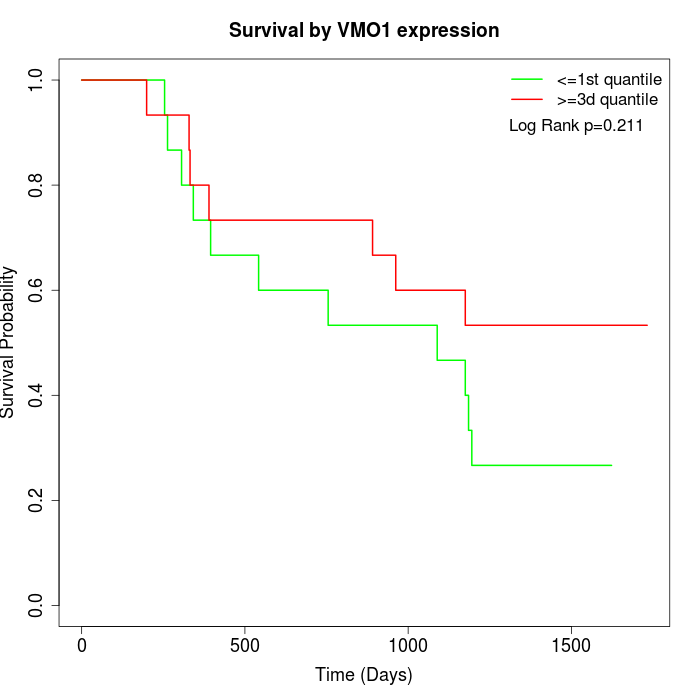 | 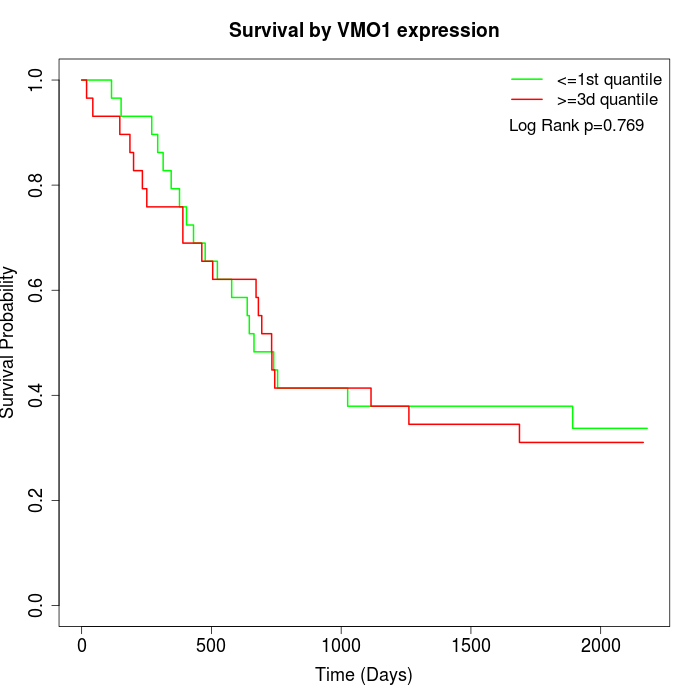 | 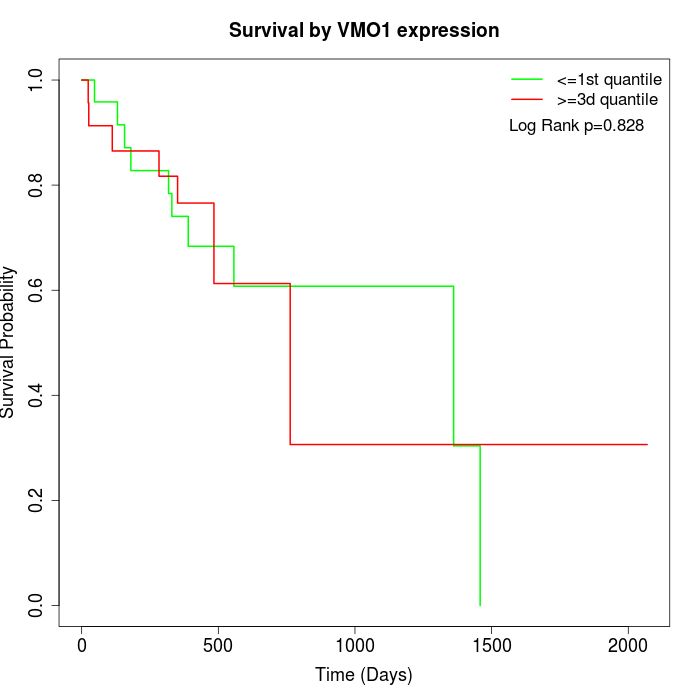 |
| GSE53622 | GSE53624 | TCGA |
Note: Click image to view full size file.
Copy number change of VMO1:
| Dataset | Gene | EntrezID | Gain | Loss | Normal | Detail |
|---|---|---|---|---|---|---|
| GSE15526 | VMO1 | 284013 | 5 | 2 | 23 | |
| GSE20123 | VMO1 | 284013 | 5 | 3 | 22 | |
| GSE43470 | VMO1 | 284013 | 1 | 6 | 36 | |
| GSE46452 | VMO1 | 284013 | 34 | 1 | 24 | |
| GSE47630 | VMO1 | 284013 | 7 | 1 | 32 | |
| GSE54993 | VMO1 | 284013 | 4 | 3 | 63 | |
| GSE54994 | VMO1 | 284013 | 5 | 9 | 39 | |
| GSE60625 | VMO1 | 284013 | 4 | 0 | 7 | |
| GSE74703 | VMO1 | 284013 | 1 | 3 | 32 | |
| GSE74704 | VMO1 | 284013 | 3 | 1 | 16 | |
| TCGA | VMO1 | 284013 | 19 | 21 | 56 |
Total number of gains: 88; Total number of losses: 50; Total Number of normals: 350.
Somatic mutations of VMO1:
Generating mutation plots.
Highly correlated genes for VMO1:
Showing top 20/110 corelated genes with mean PCC>0.5.
| Gene1 | Gene2 | Mean PCC | Num. Datasets | Num. PCC<0 | Num. PCC>0.5 |
|---|---|---|---|---|---|
| VMO1 | RLN3 | 0.780558 | 3 | 0 | 3 |
| VMO1 | DCD | 0.765629 | 3 | 0 | 3 |
| VMO1 | HOXB9 | 0.743165 | 3 | 0 | 3 |
| VMO1 | UPK3A | 0.734728 | 3 | 0 | 3 |
| VMO1 | SLC25A18 | 0.732856 | 3 | 0 | 3 |
| VMO1 | TEX13B | 0.732369 | 3 | 0 | 3 |
| VMO1 | DAO | 0.728475 | 3 | 0 | 3 |
| VMO1 | C14orf180 | 0.724061 | 3 | 0 | 3 |
| VMO1 | ESPNL | 0.723705 | 3 | 0 | 3 |
| VMO1 | IGLON5 | 0.71751 | 3 | 0 | 3 |
| VMO1 | AVPR2 | 0.713088 | 3 | 0 | 3 |
| VMO1 | PRCD | 0.710878 | 3 | 0 | 3 |
| VMO1 | CELF4 | 0.709413 | 4 | 0 | 3 |
| VMO1 | BCL2L15 | 0.704553 | 3 | 0 | 3 |
| VMO1 | LENG1 | 0.703674 | 3 | 0 | 3 |
| VMO1 | SLC30A3 | 0.699665 | 3 | 0 | 3 |
| VMO1 | PNPLA5 | 0.690648 | 3 | 0 | 3 |
| VMO1 | TM6SF2 | 0.687262 | 4 | 0 | 3 |
| VMO1 | ANKRD33B | 0.686415 | 3 | 0 | 3 |
| VMO1 | GPR150 | 0.686197 | 3 | 0 | 3 |
For details and further investigation, click here