| Full name: interleukin 19 | Alias Symbol: IL-19|MDA1|ZMDA1|IL-10C|NG.1 | ||
| Type: protein-coding gene | Cytoband: 1q32.1 | ||
| Entrez ID: 29949 | HGNC ID: HGNC:5990 | Ensembl Gene: ENSG00000142224 | OMIM ID: 605687 |
IL19 involved pathways:
| KEGG pathway | Description | View |
|---|---|---|
| hsa04630 | Jak-STAT signaling pathway |
Expression of IL19:
| Dataset | Gene | EntrezID | Probe | Log2FC | Adj.pValue | Expression |
|---|---|---|---|---|---|---|
| GSE17351 | IL19 | 29949 | 220745_at | 0.3715 | 0.5256 | |
| GSE20347 | IL19 | 29949 | 220745_at | 0.0601 | 0.6656 | |
| GSE23400 | IL19 | 29949 | 220745_at | -0.2025 | 0.0041 | |
| GSE26886 | IL19 | 29949 | 220745_at | -0.4283 | 0.4863 | |
| GSE29001 | IL19 | 29949 | 220745_at | 0.0073 | 0.9773 | |
| GSE38129 | IL19 | 29949 | 220745_at | -0.0041 | 0.9756 | |
| GSE45670 | IL19 | 29949 | 220745_at | 0.8989 | 0.0533 | |
| GSE53622 | IL19 | 29949 | 39118 | 0.8106 | 0.0002 | |
| GSE53624 | IL19 | 29949 | 39118 | 0.8334 | 0.0000 | |
| GSE63941 | IL19 | 29949 | 220745_at | 0.2390 | 0.2698 | |
| GSE77861 | IL19 | 29949 | 220745_at | 0.0565 | 0.7472 | |
| GSE97050 | IL19 | 29949 | A_23_P35092 | 0.1689 | 0.4840 | |
| TCGA | IL19 | 29949 | RNAseq | 3.3361 | 0.0001 |
Upregulated datasets: 1; Downregulated datasets: 0.
Survival by IL19 expression:
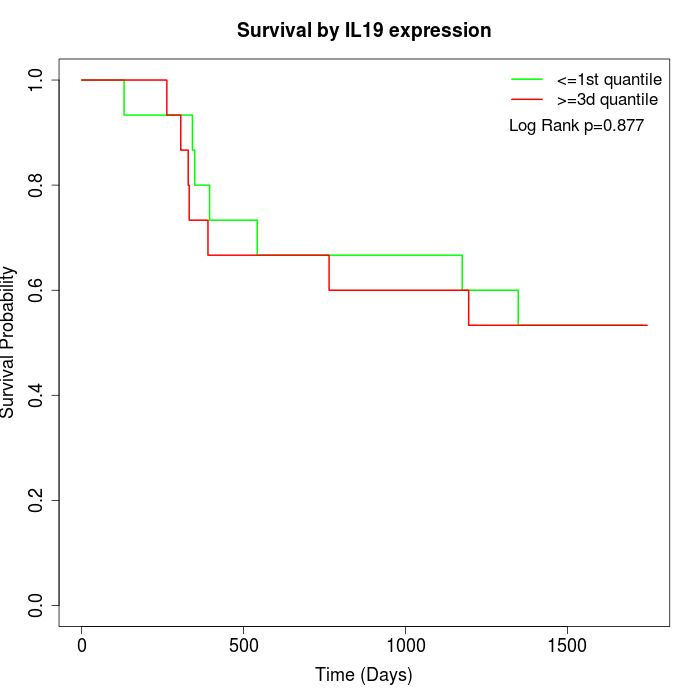 |  |  |
| GSE53622 | GSE53624 | TCGA |
Note: Click image to view full size file.
Copy number change of IL19:
| Dataset | Gene | EntrezID | Gain | Loss | Normal | Detail |
|---|---|---|---|---|---|---|
| GSE15526 | IL19 | 29949 | 11 | 0 | 19 | |
| GSE20123 | IL19 | 29949 | 11 | 0 | 19 | |
| GSE43470 | IL19 | 29949 | 7 | 0 | 36 | |
| GSE46452 | IL19 | 29949 | 3 | 1 | 55 | |
| GSE47630 | IL19 | 29949 | 14 | 0 | 26 | |
| GSE54993 | IL19 | 29949 | 0 | 6 | 64 | |
| GSE54994 | IL19 | 29949 | 14 | 0 | 39 | |
| GSE60625 | IL19 | 29949 | 0 | 0 | 11 | |
| GSE74703 | IL19 | 29949 | 7 | 0 | 29 | |
| GSE74704 | IL19 | 29949 | 5 | 0 | 15 | |
| TCGA | IL19 | 29949 | 45 | 3 | 48 |
Total number of gains: 117; Total number of losses: 10; Total Number of normals: 361.
Somatic mutations of IL19:
Generating mutation plots.
Highly correlated genes for IL19:
Showing top 20/419 corelated genes with mean PCC>0.5.
| Gene1 | Gene2 | Mean PCC | Num. Datasets | Num. PCC<0 | Num. PCC>0.5 |
|---|---|---|---|---|---|
| IL19 | TRPM3 | 0.730603 | 3 | 0 | 3 |
| IL19 | GAD2 | 0.722494 | 4 | 0 | 4 |
| IL19 | SYT13 | 0.719572 | 3 | 0 | 3 |
| IL19 | DMC1 | 0.717846 | 3 | 0 | 3 |
| IL19 | TNFSF8 | 0.714035 | 3 | 0 | 3 |
| IL19 | SLC30A3 | 0.712689 | 5 | 0 | 5 |
| IL19 | CALCB | 0.704694 | 4 | 0 | 4 |
| IL19 | LCT | 0.701233 | 4 | 0 | 4 |
| IL19 | CDH7 | 0.699844 | 4 | 0 | 4 |
| IL19 | PRR34 | 0.693874 | 4 | 0 | 4 |
| IL19 | ADAM22 | 0.688252 | 4 | 0 | 4 |
| IL19 | KRTAP5-8 | 0.685891 | 5 | 0 | 5 |
| IL19 | DCX | 0.685503 | 3 | 0 | 3 |
| IL19 | CTAGE1 | 0.682457 | 4 | 0 | 3 |
| IL19 | GPA33 | 0.681615 | 4 | 0 | 4 |
| IL19 | SH2D3C | 0.680371 | 4 | 0 | 4 |
| IL19 | IFNA16 | 0.680119 | 4 | 0 | 4 |
| IL19 | CDON | 0.675041 | 4 | 0 | 4 |
| IL19 | HLA-DOA | 0.674287 | 4 | 0 | 4 |
| IL19 | OBSL1 | 0.673631 | 3 | 0 | 3 |
For details and further investigation, click here