| Full name: synaptotagmin 13 | Alias Symbol: KIAA1427 | ||
| Type: protein-coding gene | Cytoband: 11p11.2 | ||
| Entrez ID: 57586 | HGNC ID: HGNC:14962 | Ensembl Gene: ENSG00000019505 | OMIM ID: 607716 |
Expression of SYT13:
| Dataset | Gene | EntrezID | Probe | Log2FC | Adj.pValue | Expression |
|---|---|---|---|---|---|---|
| GSE17351 | SYT13 | 57586 | 226086_at | -0.0829 | 0.9394 | |
| GSE20347 | SYT13 | 57586 | 221859_at | 0.0513 | 0.6406 | |
| GSE23400 | SYT13 | 57586 | 221859_at | -0.1886 | 0.0000 | |
| GSE26886 | SYT13 | 57586 | 226086_at | -0.0577 | 0.7646 | |
| GSE29001 | SYT13 | 57586 | 221859_at | -0.2498 | 0.1559 | |
| GSE38129 | SYT13 | 57586 | 221859_at | 0.0467 | 0.7738 | |
| GSE45670 | SYT13 | 57586 | 226086_at | 0.2369 | 0.4044 | |
| GSE53622 | SYT13 | 57586 | 103658 | 0.4229 | 0.0218 | |
| GSE53624 | SYT13 | 57586 | 103658 | 0.6565 | 0.0000 | |
| GSE63941 | SYT13 | 57586 | 226086_at | 0.8708 | 0.5098 | |
| GSE77861 | SYT13 | 57586 | 226086_at | -0.0713 | 0.6837 | |
| SRP133303 | SYT13 | 57586 | RNAseq | 0.5046 | 0.4509 | |
| SRP159526 | SYT13 | 57586 | RNAseq | 3.7799 | 0.0000 | |
| TCGA | SYT13 | 57586 | RNAseq | -1.7052 | 0.0015 |
Upregulated datasets: 1; Downregulated datasets: 1.
Survival by SYT13 expression:
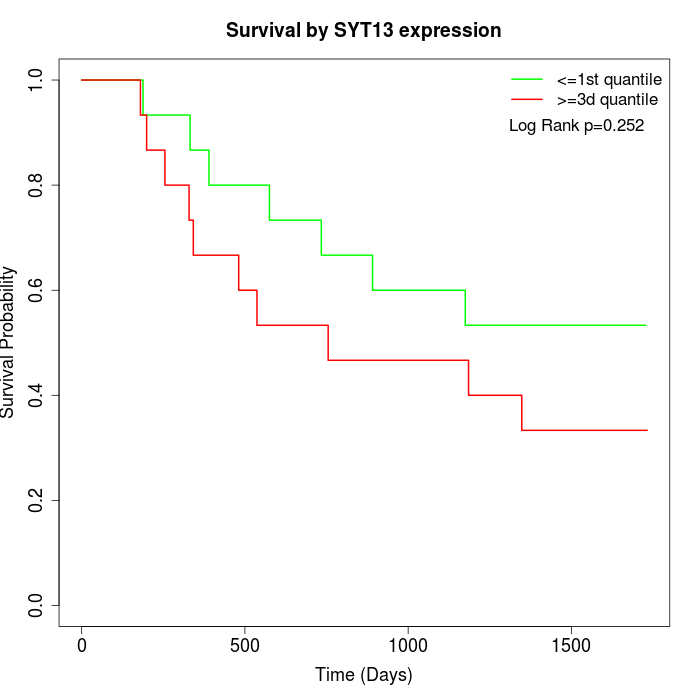 | 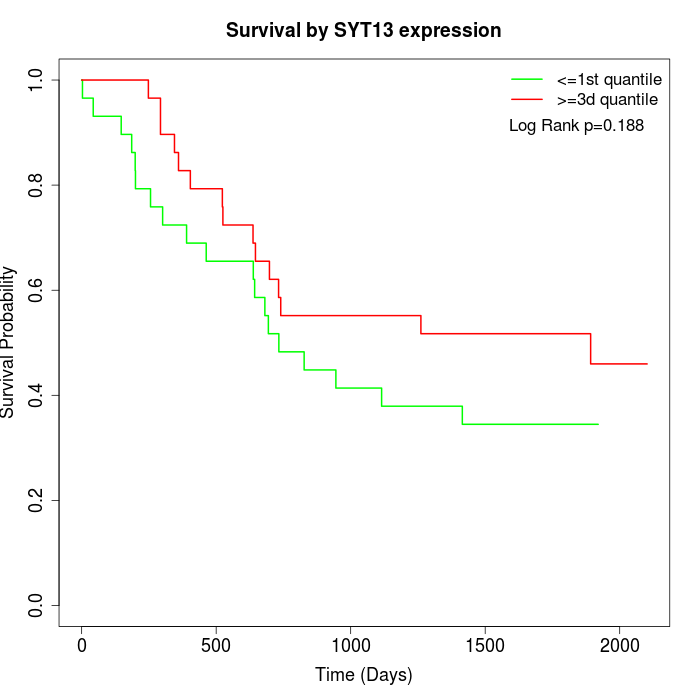 | 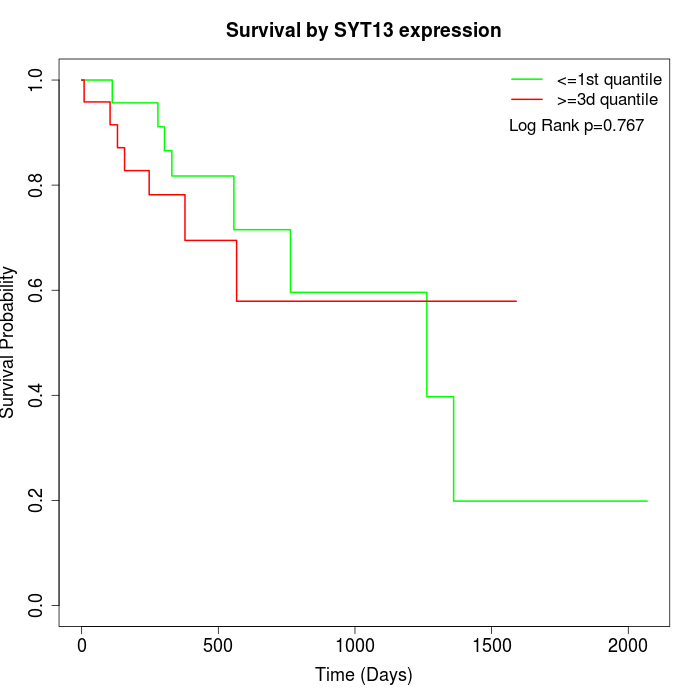 |
| GSE53622 | GSE53624 | TCGA |
Note: Click image to view full size file.
Copy number change of SYT13:
| Dataset | Gene | EntrezID | Gain | Loss | Normal | Detail |
|---|---|---|---|---|---|---|
| GSE15526 | SYT13 | 57586 | 1 | 8 | 21 | |
| GSE20123 | SYT13 | 57586 | 1 | 7 | 22 | |
| GSE43470 | SYT13 | 57586 | 2 | 4 | 37 | |
| GSE46452 | SYT13 | 57586 | 8 | 5 | 46 | |
| GSE47630 | SYT13 | 57586 | 3 | 9 | 28 | |
| GSE54993 | SYT13 | 57586 | 3 | 0 | 67 | |
| GSE54994 | SYT13 | 57586 | 3 | 9 | 41 | |
| GSE60625 | SYT13 | 57586 | 0 | 0 | 11 | |
| GSE74703 | SYT13 | 57586 | 2 | 2 | 32 | |
| GSE74704 | SYT13 | 57586 | 1 | 5 | 14 | |
| TCGA | SYT13 | 57586 | 15 | 19 | 62 |
Total number of gains: 39; Total number of losses: 68; Total Number of normals: 381.
Somatic mutations of SYT13:
Generating mutation plots.
Highly correlated genes for SYT13:
Showing top 20/458 corelated genes with mean PCC>0.5.
| Gene1 | Gene2 | Mean PCC | Num. Datasets | Num. PCC<0 | Num. PCC>0.5 |
|---|---|---|---|---|---|
| SYT13 | KRTAP5-8 | 0.799661 | 3 | 0 | 3 |
| SYT13 | HAND1 | 0.77028 | 3 | 0 | 3 |
| SYT13 | OVOL3 | 0.765502 | 3 | 0 | 3 |
| SYT13 | OR12D2 | 0.760294 | 3 | 0 | 3 |
| SYT13 | NEUROD2 | 0.759103 | 3 | 0 | 3 |
| SYT13 | KIF5A | 0.742252 | 3 | 0 | 3 |
| SYT13 | GABRR2 | 0.741174 | 3 | 0 | 3 |
| SYT13 | CXCR1 | 0.737473 | 3 | 0 | 3 |
| SYT13 | IL9R | 0.731032 | 3 | 0 | 3 |
| SYT13 | AQP6 | 0.7305 | 3 | 0 | 3 |
| SYT13 | CHAT | 0.727102 | 3 | 0 | 3 |
| SYT13 | SLC4A4 | 0.724037 | 4 | 0 | 3 |
| SYT13 | KCNJ1 | 0.722772 | 3 | 0 | 3 |
| SYT13 | GABRB2 | 0.720541 | 3 | 0 | 3 |
| SYT13 | SLC6A12 | 0.719756 | 4 | 0 | 3 |
| SYT13 | IL19 | 0.719572 | 3 | 0 | 3 |
| SYT13 | RNF17 | 0.718671 | 3 | 0 | 3 |
| SYT13 | CER1 | 0.717337 | 4 | 0 | 3 |
| SYT13 | SYN1 | 0.714875 | 4 | 0 | 4 |
| SYT13 | KIAA1614 | 0.711673 | 3 | 0 | 3 |
For details and further investigation, click here