| Full name: glutamate decarboxylase 2 | Alias Symbol: GAD65 | ||
| Type: protein-coding gene | Cytoband: 10p12.1 | ||
| Entrez ID: 2572 | HGNC ID: HGNC:4093 | Ensembl Gene: ENSG00000136750 | OMIM ID: 138275 |
Expression of GAD2:
| Dataset | Gene | EntrezID | Probe | Log2FC | Adj.pValue | Expression |
|---|---|---|---|---|---|---|
| GSE17351 | GAD2 | 2572 | 1568601_at | -0.1292 | 0.5581 | |
| GSE20347 | GAD2 | 2572 | 206780_at | 0.1106 | 0.3110 | |
| GSE23400 | GAD2 | 2572 | 206780_at | -0.0906 | 0.0416 | |
| GSE26886 | GAD2 | 2572 | 206780_at | -0.2322 | 0.0450 | |
| GSE29001 | GAD2 | 2572 | 206780_at | -0.1355 | 0.4687 | |
| GSE38129 | GAD2 | 2572 | 206780_at | -0.0898 | 0.3647 | |
| GSE45670 | GAD2 | 2572 | 1568601_at | 0.0589 | 0.4707 | |
| GSE53622 | GAD2 | 2572 | 119470 | 0.5224 | 0.0000 | |
| GSE53624 | GAD2 | 2572 | 119470 | 1.3569 | 0.0000 | |
| GSE63941 | GAD2 | 2572 | 216651_s_at | 0.1380 | 0.3488 | |
| GSE77861 | GAD2 | 2572 | 206780_at | -0.1286 | 0.2420 | |
| SRP133303 | GAD2 | 2572 | RNAseq | -0.2635 | 0.1945 | |
| SRP219564 | GAD2 | 2572 | RNAseq | -0.2544 | 0.5503 | |
| TCGA | GAD2 | 2572 | RNAseq | -1.0149 | 0.6185 |
Upregulated datasets: 1; Downregulated datasets: 0.
Survival by GAD2 expression:
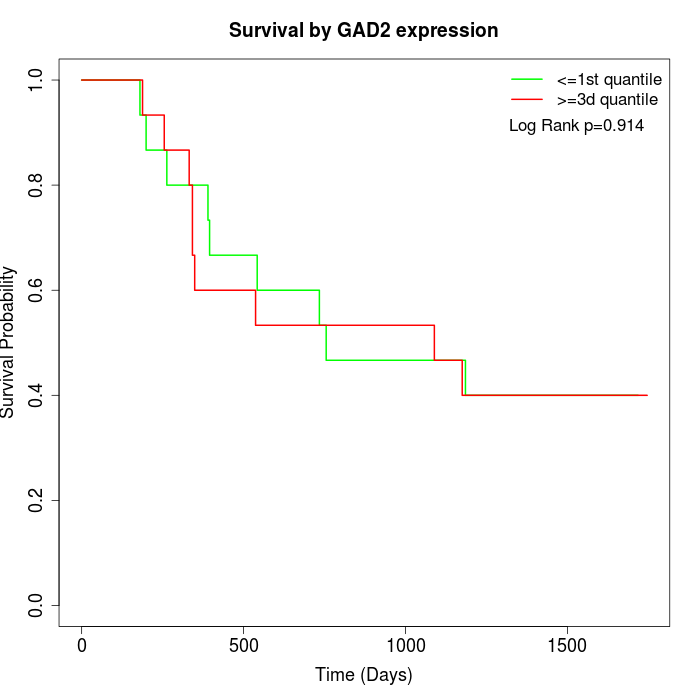 | 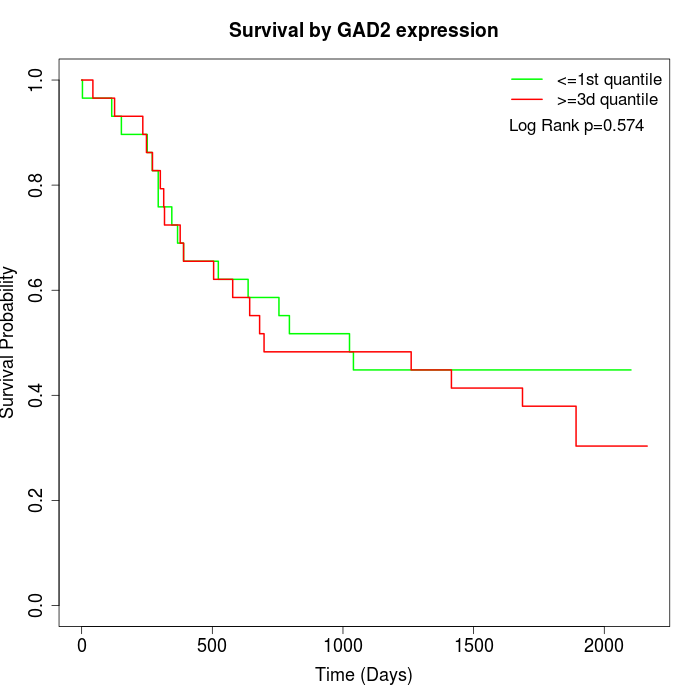 | 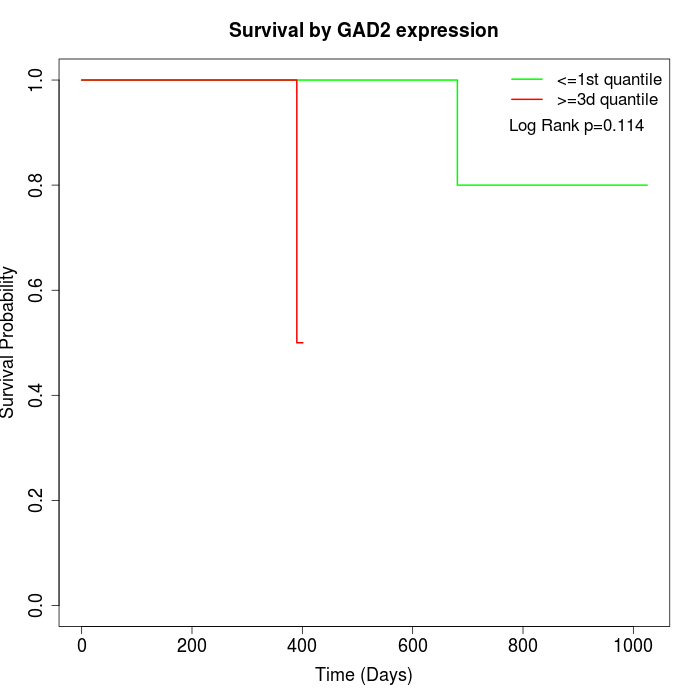 |
| GSE53622 | GSE53624 | TCGA |
Note: Click image to view full size file.
Copy number change of GAD2:
| Dataset | Gene | EntrezID | Gain | Loss | Normal | Detail |
|---|---|---|---|---|---|---|
| GSE15526 | GAD2 | 2572 | 4 | 7 | 19 | |
| GSE20123 | GAD2 | 2572 | 4 | 6 | 20 | |
| GSE43470 | GAD2 | 2572 | 3 | 4 | 36 | |
| GSE46452 | GAD2 | 2572 | 1 | 14 | 44 | |
| GSE47630 | GAD2 | 2572 | 5 | 15 | 20 | |
| GSE54993 | GAD2 | 2572 | 9 | 0 | 61 | |
| GSE54994 | GAD2 | 2572 | 3 | 10 | 40 | |
| GSE60625 | GAD2 | 2572 | 0 | 0 | 11 | |
| GSE74703 | GAD2 | 2572 | 2 | 2 | 32 | |
| GSE74704 | GAD2 | 2572 | 0 | 5 | 15 | |
| TCGA | GAD2 | 2572 | 18 | 24 | 54 |
Total number of gains: 49; Total number of losses: 87; Total Number of normals: 352.
Somatic mutations of GAD2:
Generating mutation plots.
Highly correlated genes for GAD2:
Showing top 20/909 corelated genes with mean PCC>0.5.
| Gene1 | Gene2 | Mean PCC | Num. Datasets | Num. PCC<0 | Num. PCC>0.5 |
|---|---|---|---|---|---|
| GAD2 | JAK3 | 0.774107 | 4 | 0 | 4 |
| GAD2 | CER1 | 0.752912 | 4 | 0 | 4 |
| GAD2 | CYSLTR2 | 0.749387 | 4 | 0 | 4 |
| GAD2 | KIR2DL2 | 0.742809 | 4 | 0 | 4 |
| GAD2 | KCNA1 | 0.742266 | 4 | 0 | 4 |
| GAD2 | IFNA17 | 0.733867 | 5 | 0 | 5 |
| GAD2 | EPX | 0.728179 | 4 | 0 | 4 |
| GAD2 | KCNJ10 | 0.727662 | 4 | 0 | 4 |
| GAD2 | SH2D3C | 0.725527 | 4 | 0 | 4 |
| GAD2 | IL19 | 0.722494 | 4 | 0 | 4 |
| GAD2 | PRR34 | 0.722238 | 6 | 0 | 5 |
| GAD2 | PRL | 0.71912 | 6 | 0 | 6 |
| GAD2 | PLCB2 | 0.717545 | 3 | 0 | 3 |
| GAD2 | TAS2R4 | 0.714385 | 5 | 0 | 5 |
| GAD2 | GABRB2 | 0.713854 | 4 | 0 | 4 |
| GAD2 | MTAP | 0.713328 | 5 | 0 | 4 |
| GAD2 | CYP3A4 | 0.712965 | 4 | 0 | 4 |
| GAD2 | ITGB3 | 0.712204 | 4 | 0 | 3 |
| GAD2 | CALCR | 0.711707 | 5 | 0 | 5 |
| GAD2 | KIR2DS2 | 0.708626 | 5 | 0 | 5 |
For details and further investigation, click here