| Full name: integrin subunit beta 1 | Alias Symbol: CD29|GPIIA | ||
| Type: protein-coding gene | Cytoband: 10p11.22 | ||
| Entrez ID: 3688 | HGNC ID: HGNC:6153 | Ensembl Gene: ENSG00000150093 | OMIM ID: 135630 |
| Related drugs: BELAPERIDONE, CHEMBL88478, DI17E6, ETARACIZUMAB, FIRATEGRAST, INTETUMUMAB, NATALIZUMAB, PF-04605412, SNAP-7941, VALATEGRAST HYDROCHLORIDE... [more] | |||
Screen Evidence:
| |||
ITGB1 involved pathways:
Expression of ITGB1:
| Dataset | Gene | EntrezID | Probe | Log2FC | Adj.pValue | Expression |
|---|---|---|---|---|---|---|
| GSE17351 | ITGB1 | 3688 | 211945_s_at | 0.3062 | 0.4806 | |
| GSE20347 | ITGB1 | 3688 | 211945_s_at | 0.7767 | 0.0002 | |
| GSE23400 | ITGB1 | 3688 | 211945_s_at | 0.5736 | 0.0000 | |
| GSE26886 | ITGB1 | 3688 | 211945_s_at | 0.6966 | 0.0001 | |
| GSE29001 | ITGB1 | 3688 | 211945_s_at | 0.4177 | 0.0744 | |
| GSE38129 | ITGB1 | 3688 | 211945_s_at | 0.4078 | 0.0585 | |
| GSE45670 | ITGB1 | 3688 | 211945_s_at | -0.0742 | 0.8156 | |
| GSE53622 | ITGB1 | 3688 | 56043 | 0.7088 | 0.0000 | |
| GSE53624 | ITGB1 | 3688 | 56043 | 0.8769 | 0.0000 | |
| GSE63941 | ITGB1 | 3688 | 211945_s_at | -1.4104 | 0.0019 | |
| GSE77861 | ITGB1 | 3688 | 211945_s_at | 0.6386 | 0.1426 | |
| GSE97050 | ITGB1 | 3688 | A_23_P104199 | 0.1582 | 0.5191 | |
| SRP007169 | ITGB1 | 3688 | RNAseq | 0.9105 | 0.0066 | |
| SRP008496 | ITGB1 | 3688 | RNAseq | 1.6253 | 0.0000 | |
| SRP064894 | ITGB1 | 3688 | RNAseq | 0.7853 | 0.0012 | |
| SRP133303 | ITGB1 | 3688 | RNAseq | 1.1455 | 0.0000 | |
| SRP159526 | ITGB1 | 3688 | RNAseq | 0.4086 | 0.2883 | |
| SRP193095 | ITGB1 | 3688 | RNAseq | 0.9351 | 0.0000 | |
| SRP219564 | ITGB1 | 3688 | RNAseq | -0.0220 | 0.9737 | |
| TCGA | ITGB1 | 3688 | RNAseq | 0.0190 | 0.7229 |
Upregulated datasets: 2; Downregulated datasets: 1.
Survival by ITGB1 expression:
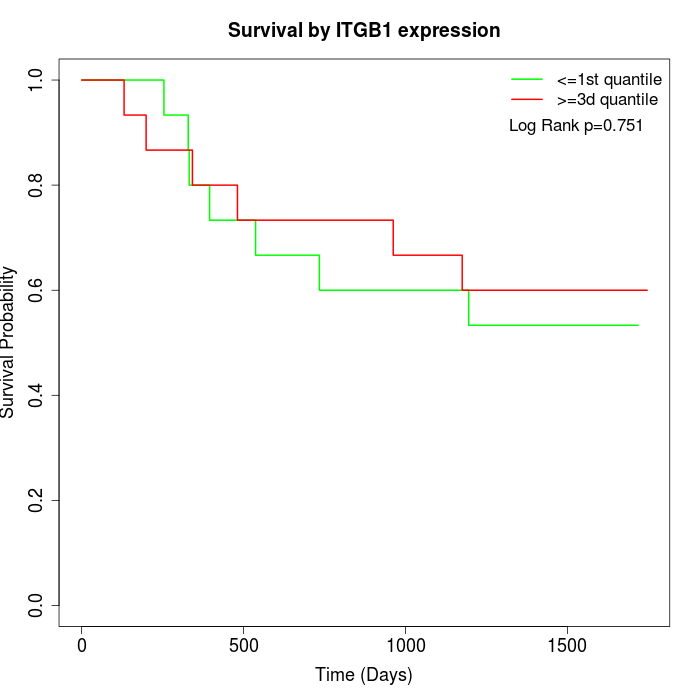 | 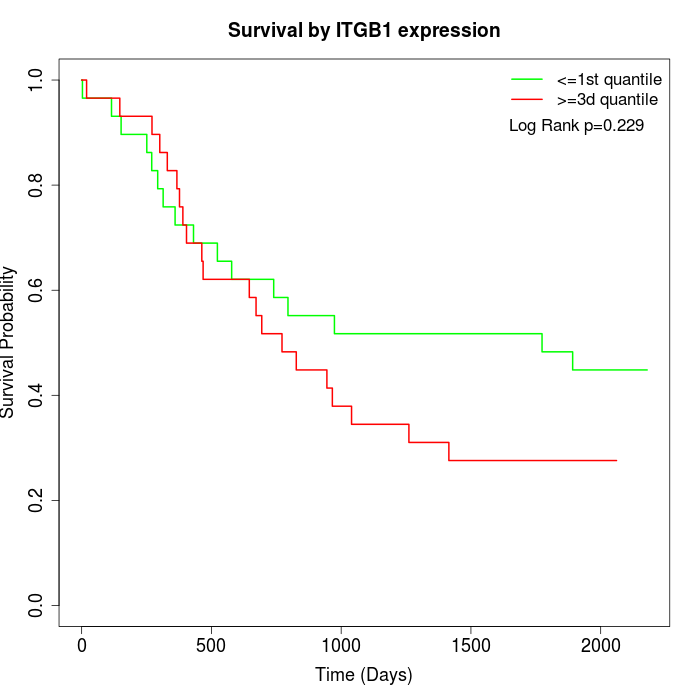 |  |
| GSE53622 | GSE53624 | TCGA |
Note: Click image to view full size file.
Copy number change of ITGB1:
| Dataset | Gene | EntrezID | Gain | Loss | Normal | Detail |
|---|---|---|---|---|---|---|
| GSE15526 | ITGB1 | 3688 | 5 | 7 | 18 | |
| GSE20123 | ITGB1 | 3688 | 5 | 6 | 19 | |
| GSE43470 | ITGB1 | 3688 | 4 | 3 | 36 | |
| GSE46452 | ITGB1 | 3688 | 1 | 14 | 44 | |
| GSE47630 | ITGB1 | 3688 | 5 | 15 | 20 | |
| GSE54993 | ITGB1 | 3688 | 9 | 0 | 61 | |
| GSE54994 | ITGB1 | 3688 | 3 | 8 | 42 | |
| GSE60625 | ITGB1 | 3688 | 0 | 0 | 11 | |
| GSE74703 | ITGB1 | 3688 | 2 | 2 | 32 | |
| GSE74704 | ITGB1 | 3688 | 0 | 5 | 15 | |
| TCGA | ITGB1 | 3688 | 16 | 24 | 56 |
Total number of gains: 50; Total number of losses: 84; Total Number of normals: 354.
Somatic mutations of ITGB1:
Generating mutation plots.
Highly correlated genes for ITGB1:
Showing top 20/1376 corelated genes with mean PCC>0.5.
| Gene1 | Gene2 | Mean PCC | Num. Datasets | Num. PCC<0 | Num. PCC>0.5 |
|---|---|---|---|---|---|
| ITGB1 | RAB34 | 0.817215 | 3 | 0 | 3 |
| ITGB1 | LAMC1 | 0.786131 | 13 | 0 | 13 |
| ITGB1 | MICAL2 | 0.783847 | 9 | 0 | 9 |
| ITGB1 | FGF7 | 0.756274 | 3 | 0 | 3 |
| ITGB1 | C11orf96 | 0.746804 | 4 | 0 | 3 |
| ITGB1 | LTBP1 | 0.744404 | 12 | 0 | 12 |
| ITGB1 | TMEM263 | 0.736175 | 7 | 0 | 7 |
| ITGB1 | LGALS1 | 0.736085 | 13 | 0 | 12 |
| ITGB1 | FBN1 | 0.732816 | 10 | 0 | 10 |
| ITGB1 | LRRC8C | 0.730064 | 3 | 0 | 3 |
| ITGB1 | CALU | 0.728394 | 12 | 0 | 12 |
| ITGB1 | FILIP1 | 0.725203 | 3 | 0 | 3 |
| ITGB1 | HTRA1 | 0.724625 | 13 | 0 | 13 |
| ITGB1 | CLIC4 | 0.724412 | 13 | 0 | 11 |
| ITGB1 | GLIS2 | 0.722162 | 7 | 0 | 7 |
| ITGB1 | FSTL1 | 0.722055 | 13 | 0 | 13 |
| ITGB1 | RHOBTB1 | 0.721798 | 13 | 0 | 13 |
| ITGB1 | CEP170 | 0.721449 | 3 | 0 | 3 |
| ITGB1 | FKBP7 | 0.71935 | 8 | 0 | 8 |
| ITGB1 | RFTN1 | 0.714573 | 12 | 0 | 11 |
For details and further investigation, click here