| Full name: nuclear receptor subfamily 2 group E member 1 | Alias Symbol: TLL|XTLL | ||
| Type: protein-coding gene | Cytoband: 6q21 | ||
| Entrez ID: 7101 | HGNC ID: HGNC:7973 | Ensembl Gene: ENSG00000112333 | OMIM ID: 603849 |
Expression of NR2E1:
| Dataset | Gene | EntrezID | Probe | Log2FC | Adj.pValue | Expression |
|---|---|---|---|---|---|---|
| GSE17351 | NR2E1 | 7101 | 207443_at | 0.9734 | 0.1630 | |
| GSE20347 | NR2E1 | 7101 | 207443_at | 0.1480 | 0.1912 | |
| GSE23400 | NR2E1 | 7101 | 207443_at | 0.0176 | 0.7707 | |
| GSE26886 | NR2E1 | 7101 | 207443_at | 0.6667 | 0.0790 | |
| GSE29001 | NR2E1 | 7101 | 207443_at | 0.0251 | 0.9329 | |
| GSE38129 | NR2E1 | 7101 | 207443_at | 0.1770 | 0.1347 | |
| GSE45670 | NR2E1 | 7101 | 207443_at | 0.4802 | 0.2974 | |
| GSE53622 | NR2E1 | 7101 | 49499 | 0.3843 | 0.0303 | |
| GSE53624 | NR2E1 | 7101 | 49499 | -0.0968 | 0.4791 | |
| GSE63941 | NR2E1 | 7101 | 207443_at | 0.4208 | 0.5473 | |
| GSE77861 | NR2E1 | 7101 | 207443_at | 0.0500 | 0.7980 | |
| GSE97050 | NR2E1 | 7101 | A_23_P338372 | 0.1104 | 0.5737 | |
| TCGA | NR2E1 | 7101 | RNAseq | 1.0952 | 0.0847 |
Upregulated datasets: 0; Downregulated datasets: 0.
Survival by NR2E1 expression:
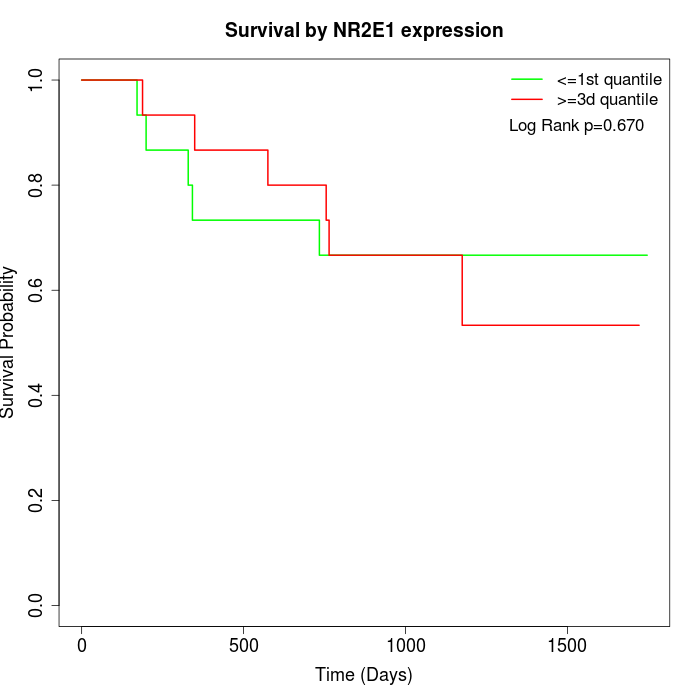 | 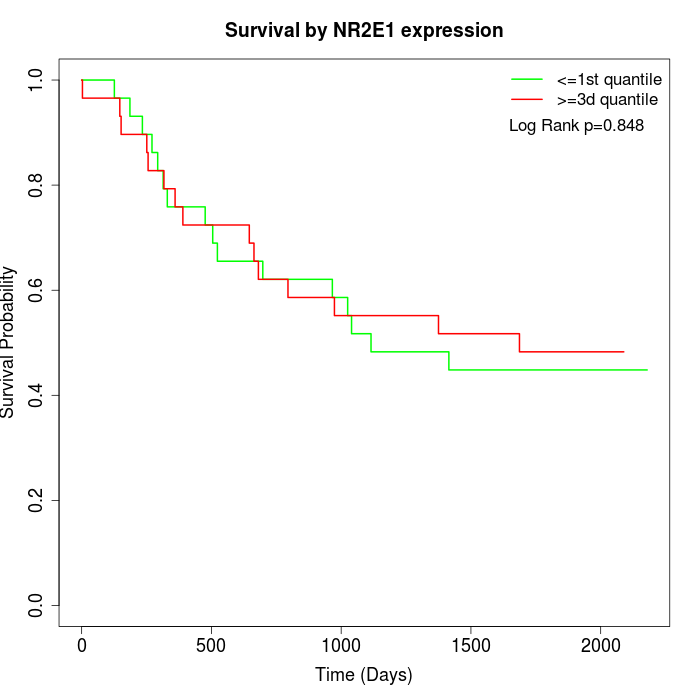 | 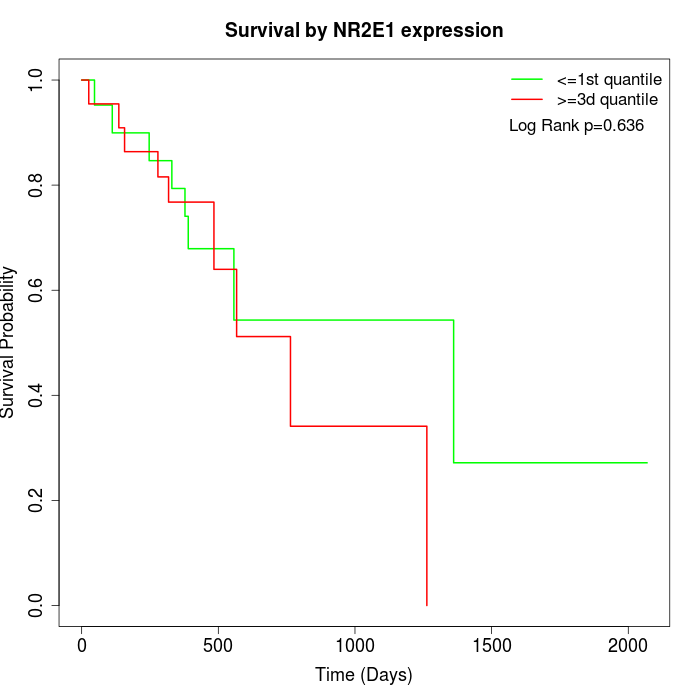 |
| GSE53622 | GSE53624 | TCGA |
Note: Click image to view full size file.
Copy number change of NR2E1:
| Dataset | Gene | EntrezID | Gain | Loss | Normal | Detail |
|---|---|---|---|---|---|---|
| GSE15526 | NR2E1 | 7101 | 2 | 3 | 25 | |
| GSE20123 | NR2E1 | 7101 | 2 | 2 | 26 | |
| GSE43470 | NR2E1 | 7101 | 3 | 1 | 39 | |
| GSE46452 | NR2E1 | 7101 | 2 | 11 | 46 | |
| GSE47630 | NR2E1 | 7101 | 9 | 4 | 27 | |
| GSE54993 | NR2E1 | 7101 | 3 | 2 | 65 | |
| GSE54994 | NR2E1 | 7101 | 8 | 8 | 37 | |
| GSE60625 | NR2E1 | 7101 | 0 | 2 | 9 | |
| GSE74703 | NR2E1 | 7101 | 2 | 1 | 33 | |
| GSE74704 | NR2E1 | 7101 | 0 | 0 | 20 | |
| TCGA | NR2E1 | 7101 | 6 | 22 | 68 |
Total number of gains: 37; Total number of losses: 56; Total Number of normals: 395.
Somatic mutations of NR2E1:
Generating mutation plots.
Highly correlated genes for NR2E1:
Showing top 20/118 corelated genes with mean PCC>0.5.
| Gene1 | Gene2 | Mean PCC | Num. Datasets | Num. PCC<0 | Num. PCC>0.5 |
|---|---|---|---|---|---|
| NR2E1 | ANXA10 | 0.804194 | 3 | 0 | 3 |
| NR2E1 | LINC01096 | 0.798157 | 3 | 0 | 3 |
| NR2E1 | HAUS8 | 0.782785 | 3 | 0 | 3 |
| NR2E1 | ZNF687 | 0.763427 | 3 | 0 | 3 |
| NR2E1 | NPW | 0.738485 | 3 | 0 | 3 |
| NR2E1 | SIX2 | 0.730077 | 3 | 0 | 3 |
| NR2E1 | WDR90 | 0.711709 | 3 | 0 | 3 |
| NR2E1 | TBC1D10B | 0.702898 | 3 | 0 | 3 |
| NR2E1 | KAT2A | 0.700839 | 3 | 0 | 3 |
| NR2E1 | FCN2 | 0.698396 | 3 | 0 | 3 |
| NR2E1 | C6orf15 | 0.697727 | 3 | 0 | 3 |
| NR2E1 | FSIP1 | 0.690978 | 3 | 0 | 3 |
| NR2E1 | LYG1 | 0.685576 | 3 | 0 | 3 |
| NR2E1 | POLE | 0.684483 | 3 | 0 | 3 |
| NR2E1 | PIP5KL1 | 0.683048 | 3 | 0 | 3 |
| NR2E1 | NKX2-2 | 0.682866 | 5 | 0 | 4 |
| NR2E1 | SFTPD | 0.681242 | 4 | 0 | 3 |
| NR2E1 | RIPPLY3 | 0.675541 | 5 | 0 | 5 |
| NR2E1 | HSF2BP | 0.667041 | 6 | 0 | 4 |
| NR2E1 | RASL10B | 0.655846 | 3 | 0 | 3 |
For details and further investigation, click here