| Full name: LIM homeobox 5 | Alias Symbol: | ||
| Type: protein-coding gene | Cytoband: 12q24.13 | ||
| Entrez ID: 64211 | HGNC ID: HGNC:14216 | Ensembl Gene: ENSG00000089116 | OMIM ID: 605992 |
Expression of LHX5:
| Dataset | Gene | EntrezID | Probe | Log2FC | Adj.pValue | Expression |
|---|---|---|---|---|---|---|
| GSE17351 | LHX5 | 64211 | 208333_at | -0.0065 | 0.9822 | |
| GSE20347 | LHX5 | 64211 | 208333_at | -0.0426 | 0.5352 | |
| GSE23400 | LHX5 | 64211 | 208333_at | -0.0640 | 0.0053 | |
| GSE26886 | LHX5 | 64211 | 208333_at | 0.4933 | 0.0003 | |
| GSE29001 | LHX5 | 64211 | 208333_at | 0.0124 | 0.9119 | |
| GSE38129 | LHX5 | 64211 | 208333_at | -0.0765 | 0.2331 | |
| GSE45670 | LHX5 | 64211 | 208333_at | 0.0267 | 0.8131 | |
| GSE53622 | LHX5 | 64211 | 26381 | 2.8782 | 0.0000 | |
| GSE53624 | LHX5 | 64211 | 26381 | 3.1210 | 0.0000 | |
| GSE63941 | LHX5 | 64211 | 208333_at | 0.2695 | 0.1251 | |
| GSE77861 | LHX5 | 64211 | 208333_at | -0.0091 | 0.9538 | |
| GSE97050 | LHX5 | 64211 | A_23_P47967 | 0.3608 | 0.3024 | |
| SRP159526 | LHX5 | 64211 | RNAseq | 7.1177 | 0.0000 | |
| TCGA | LHX5 | 64211 | RNAseq | 0.4569 | 0.3788 |
Upregulated datasets: 3; Downregulated datasets: 0.
Survival by LHX5 expression:
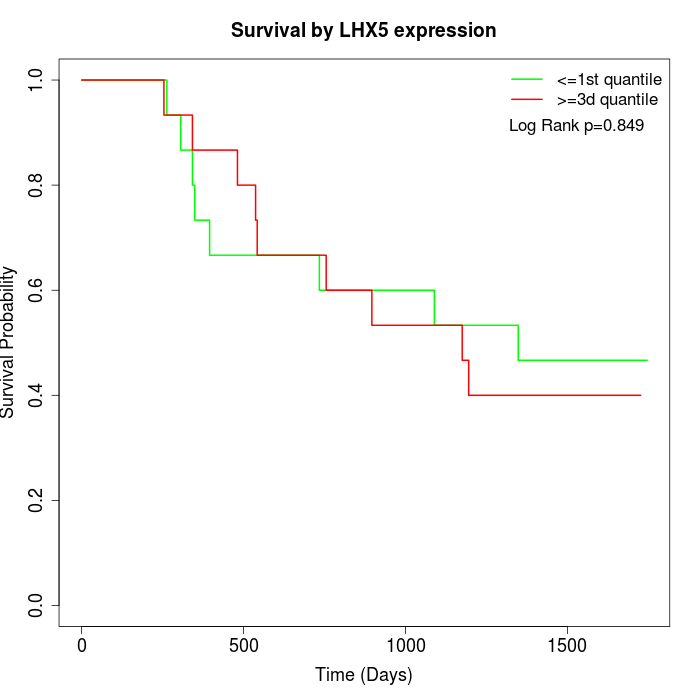 | 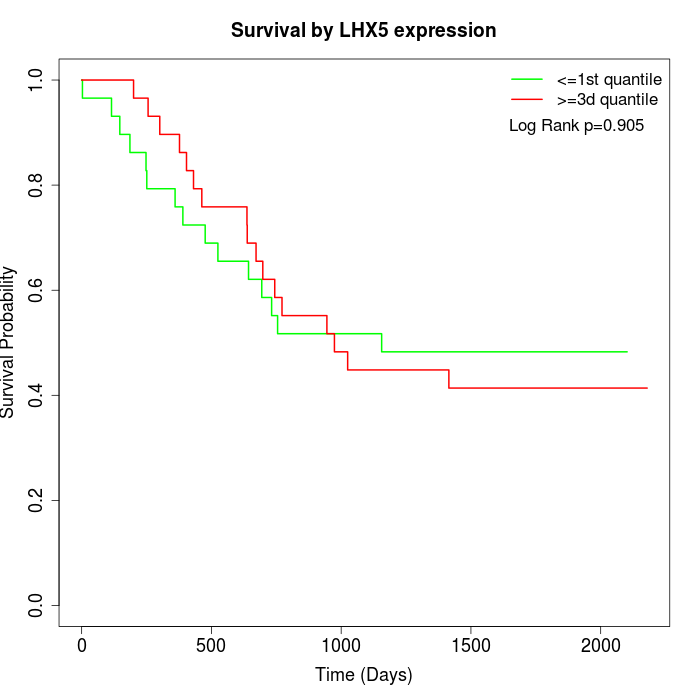 | 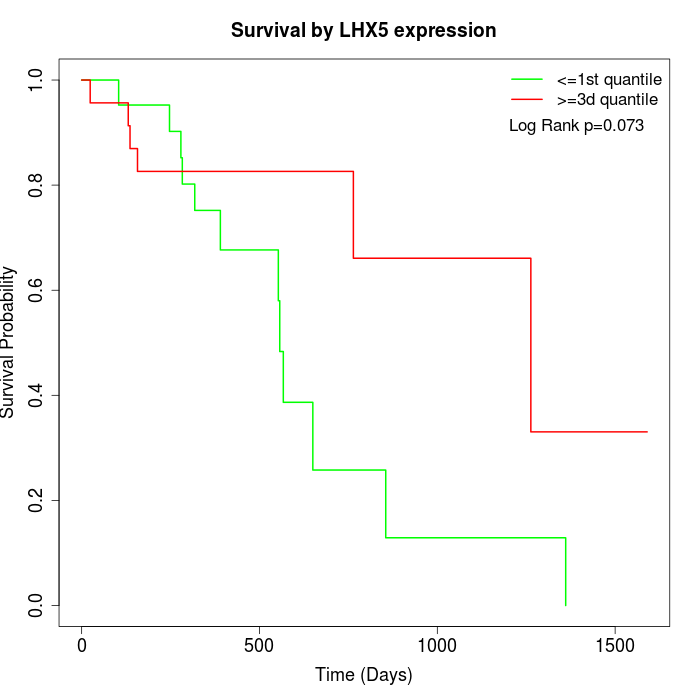 |
| GSE53622 | GSE53624 | TCGA |
Note: Click image to view full size file.
Copy number change of LHX5:
| Dataset | Gene | EntrezID | Gain | Loss | Normal | Detail |
|---|---|---|---|---|---|---|
| GSE15526 | LHX5 | 64211 | 4 | 3 | 23 | |
| GSE20123 | LHX5 | 64211 | 4 | 3 | 23 | |
| GSE43470 | LHX5 | 64211 | 2 | 0 | 41 | |
| GSE46452 | LHX5 | 64211 | 9 | 1 | 49 | |
| GSE47630 | LHX5 | 64211 | 9 | 3 | 28 | |
| GSE54993 | LHX5 | 64211 | 0 | 5 | 65 | |
| GSE54994 | LHX5 | 64211 | 4 | 2 | 47 | |
| GSE60625 | LHX5 | 64211 | 0 | 0 | 11 | |
| GSE74703 | LHX5 | 64211 | 2 | 0 | 34 | |
| GSE74704 | LHX5 | 64211 | 2 | 2 | 16 | |
| TCGA | LHX5 | 64211 | 22 | 11 | 63 |
Total number of gains: 58; Total number of losses: 30; Total Number of normals: 400.
Somatic mutations of LHX5:
Generating mutation plots.
Highly correlated genes for LHX5:
Showing top 20/613 corelated genes with mean PCC>0.5.
| Gene1 | Gene2 | Mean PCC | Num. Datasets | Num. PCC<0 | Num. PCC>0.5 |
|---|---|---|---|---|---|
| LHX5 | FHL3 | 0.749426 | 4 | 0 | 4 |
| LHX5 | PTRH2 | 0.747539 | 4 | 0 | 4 |
| LHX5 | TRMT61A | 0.740026 | 4 | 0 | 4 |
| LHX5 | COLGALT1 | 0.739991 | 3 | 0 | 3 |
| LHX5 | PLAU | 0.737941 | 4 | 0 | 4 |
| LHX5 | PSMG4 | 0.736461 | 3 | 0 | 3 |
| LHX5 | GAS6-AS1 | 0.734482 | 3 | 0 | 3 |
| LHX5 | ZNF266 | 0.712846 | 3 | 0 | 3 |
| LHX5 | ABHD16B | 0.709674 | 3 | 0 | 3 |
| LHX5 | CPT1C | 0.707832 | 4 | 0 | 4 |
| LHX5 | BAIAP2L2 | 0.704489 | 4 | 0 | 4 |
| LHX5 | FBLIM1 | 0.704005 | 4 | 0 | 4 |
| LHX5 | FAM89A | 0.69747 | 3 | 0 | 3 |
| LHX5 | USP48 | 0.694406 | 3 | 0 | 3 |
| LHX5 | XKR8 | 0.692536 | 3 | 0 | 3 |
| LHX5 | ZNF358 | 0.690163 | 4 | 0 | 4 |
| LHX5 | MTBP | 0.68545 | 3 | 0 | 3 |
| LHX5 | ACAP1 | 0.68449 | 3 | 0 | 3 |
| LHX5 | MTHFD1L | 0.680244 | 3 | 0 | 3 |
| LHX5 | PLOD1 | 0.6787 | 4 | 0 | 4 |
For details and further investigation, click here