| Full name: lysophosphatidic acid receptor 1 | Alias Symbol: edg-2|rec.1.3|vzg-1|Gpcr26|Mrec1.3|LPA1|GPR26 | ||
| Type: protein-coding gene | Cytoband: 9q31.3 | ||
| Entrez ID: 1902 | HGNC ID: HGNC:3166 | Ensembl Gene: ENSG00000198121 | OMIM ID: 602282 |
| Related drugs: CYCLOPENTOLATE, CYPROHEPTADINE, PROSCILLARIDIN... [more] | |||
Screen Evidence:
| |||
LPAR1 involved pathways:
| KEGG pathway | Description | View |
|---|---|---|
| hsa04015 | Rap1 signaling pathway | |
| hsa04072 | Phospholipase D signaling pathway | |
| hsa04151 | PI3K-Akt signaling pathway | |
| hsa04540 | Gap junction |
Expression of LPAR1:
| Dataset | Gene | EntrezID | Probe | Log2FC | Adj.pValue | Expression |
|---|---|---|---|---|---|---|
| GSE17351 | LPAR1 | 1902 | 204036_at | -1.0812 | 0.0559 | |
| GSE20347 | LPAR1 | 1902 | 204036_at | -1.1101 | 0.0000 | |
| GSE23400 | LPAR1 | 1902 | 204038_s_at | -0.0279 | 0.4962 | |
| GSE26886 | LPAR1 | 1902 | 204037_at | -0.6642 | 0.0505 | |
| GSE29001 | LPAR1 | 1902 | 204037_at | -0.5115 | 0.0880 | |
| GSE38129 | LPAR1 | 1902 | 204036_at | -1.1493 | 0.0000 | |
| GSE45670 | LPAR1 | 1902 | 204036_at | -1.3221 | 0.0001 | |
| GSE53622 | LPAR1 | 1902 | 174243 | -0.6294 | 0.0000 | |
| GSE53624 | LPAR1 | 1902 | 174243 | -0.6407 | 0.0000 | |
| GSE63941 | LPAR1 | 1902 | 204038_s_at | -1.8610 | 0.0450 | |
| GSE77861 | LPAR1 | 1902 | 204037_at | -0.2236 | 0.0926 | |
| GSE97050 | LPAR1 | 1902 | A_33_P3383326 | -0.2941 | 0.2272 | |
| SRP007169 | LPAR1 | 1902 | RNAseq | 0.0792 | 0.8827 | |
| SRP008496 | LPAR1 | 1902 | RNAseq | 0.6149 | 0.0656 | |
| SRP064894 | LPAR1 | 1902 | RNAseq | 0.1576 | 0.6166 | |
| SRP133303 | LPAR1 | 1902 | RNAseq | -0.7096 | 0.0001 | |
| SRP159526 | LPAR1 | 1902 | RNAseq | 0.3192 | 0.3953 | |
| SRP193095 | LPAR1 | 1902 | RNAseq | -0.1396 | 0.5538 | |
| SRP219564 | LPAR1 | 1902 | RNAseq | 0.2548 | 0.6517 | |
| TCGA | LPAR1 | 1902 | RNAseq | -0.2500 | 0.0528 |
Upregulated datasets: 0; Downregulated datasets: 4.
Survival by LPAR1 expression:
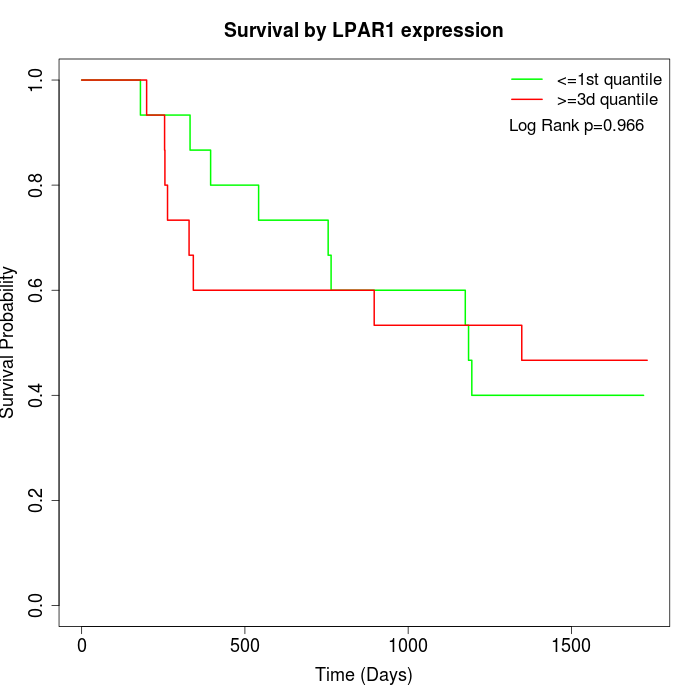 | 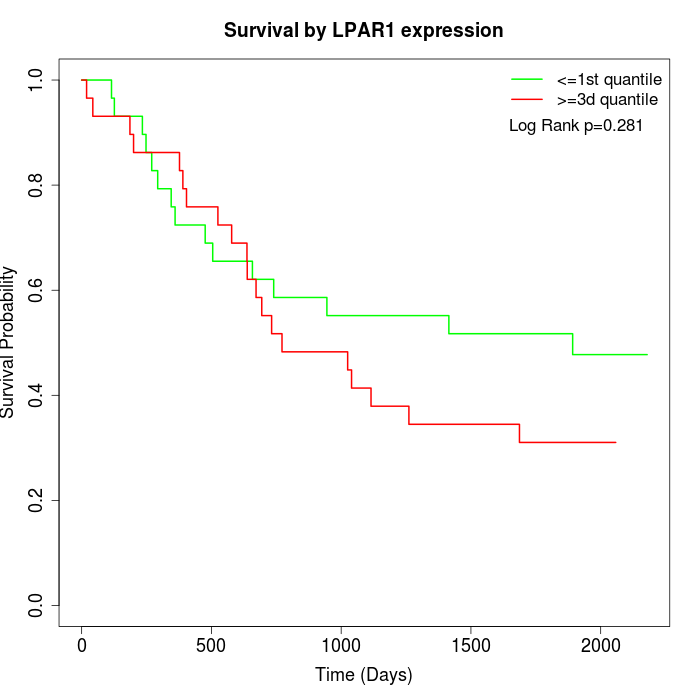 | 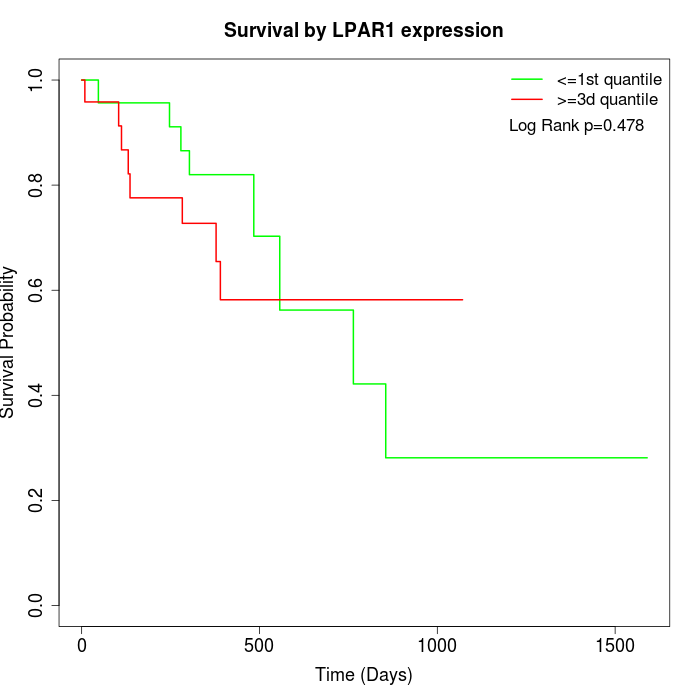 |
| GSE53622 | GSE53624 | TCGA |
Note: Click image to view full size file.
Copy number change of LPAR1:
| Dataset | Gene | EntrezID | Gain | Loss | Normal | Detail |
|---|---|---|---|---|---|---|
| GSE15526 | LPAR1 | 1902 | 5 | 9 | 16 | |
| GSE20123 | LPAR1 | 1902 | 5 | 8 | 17 | |
| GSE43470 | LPAR1 | 1902 | 4 | 3 | 36 | |
| GSE46452 | LPAR1 | 1902 | 6 | 13 | 40 | |
| GSE47630 | LPAR1 | 1902 | 3 | 16 | 21 | |
| GSE54993 | LPAR1 | 1902 | 3 | 3 | 64 | |
| GSE54994 | LPAR1 | 1902 | 9 | 10 | 34 | |
| GSE60625 | LPAR1 | 1902 | 0 | 0 | 11 | |
| GSE74703 | LPAR1 | 1902 | 4 | 3 | 29 | |
| GSE74704 | LPAR1 | 1902 | 2 | 6 | 12 | |
| TCGA | LPAR1 | 1902 | 25 | 23 | 48 |
Total number of gains: 66; Total number of losses: 94; Total Number of normals: 328.
Somatic mutations of LPAR1:
Generating mutation plots.
Highly correlated genes for LPAR1:
Showing top 20/963 corelated genes with mean PCC>0.5.
| Gene1 | Gene2 | Mean PCC | Num. Datasets | Num. PCC<0 | Num. PCC>0.5 |
|---|---|---|---|---|---|
| LPAR1 | LINC01279 | 0.758513 | 3 | 0 | 3 |
| LPAR1 | TAF9B | 0.749907 | 3 | 0 | 3 |
| LPAR1 | TMEM114 | 0.743532 | 3 | 0 | 3 |
| LPAR1 | ATF6 | 0.729744 | 3 | 0 | 3 |
| LPAR1 | SPAG8 | 0.727211 | 4 | 0 | 3 |
| LPAR1 | CYP4V2 | 0.720442 | 4 | 0 | 4 |
| LPAR1 | FIBIN | 0.718808 | 4 | 0 | 3 |
| LPAR1 | STARD9 | 0.718162 | 3 | 0 | 3 |
| LPAR1 | ZNF583 | 0.710315 | 3 | 0 | 3 |
| LPAR1 | MYCN | 0.701433 | 3 | 0 | 3 |
| LPAR1 | LYVE1 | 0.701039 | 6 | 0 | 6 |
| LPAR1 | ADAMTS5 | 0.698991 | 7 | 0 | 7 |
| LPAR1 | TRAK2 | 0.697114 | 8 | 0 | 7 |
| LPAR1 | FBXL3 | 0.693286 | 5 | 0 | 4 |
| LPAR1 | DTNA | 0.692699 | 4 | 0 | 3 |
| LPAR1 | GNPDA2 | 0.690414 | 6 | 0 | 6 |
| LPAR1 | CYTH2 | 0.687097 | 3 | 0 | 3 |
| LPAR1 | CLEC3B | 0.684869 | 3 | 0 | 3 |
| LPAR1 | SMDT1 | 0.683523 | 3 | 0 | 3 |
| LPAR1 | IGSF10 | 0.681854 | 5 | 0 | 4 |
For details and further investigation, click here