| Full name: transcription factor AP-2 epsilon | Alias Symbol: AP2E | ||
| Type: protein-coding gene | Cytoband: 1p34.3 | ||
| Entrez ID: 339488 | HGNC ID: HGNC:30774 | Ensembl Gene: ENSG00000116819 | OMIM ID: 614428 |
Expression of TFAP2E:
| Dataset | Gene | EntrezID | Probe | Log2FC | Adj.pValue | Expression |
|---|---|---|---|---|---|---|
| GSE17351 | TFAP2E | 339488 | 1555348_at | 0.5751 | 0.4359 | |
| GSE26886 | TFAP2E | 339488 | 1555348_at | 0.1088 | 0.6865 | |
| GSE45670 | TFAP2E | 339488 | 1555348_at | 0.4187 | 0.0367 | |
| GSE53622 | TFAP2E | 339488 | 133313 | -0.4100 | 0.0000 | |
| GSE53624 | TFAP2E | 339488 | 133313 | -0.2416 | 0.0122 | |
| GSE63941 | TFAP2E | 339488 | 1555348_at | 0.0694 | 0.7745 | |
| GSE77861 | TFAP2E | 339488 | 1555348_at | -0.0812 | 0.6312 | |
| GSE97050 | TFAP2E | 339488 | A_23_P322116 | 0.0169 | 0.9578 | |
| SRP064894 | TFAP2E | 339488 | RNAseq | 1.0005 | 0.0010 | |
| SRP133303 | TFAP2E | 339488 | RNAseq | 0.5022 | 0.1809 | |
| SRP159526 | TFAP2E | 339488 | RNAseq | 0.7779 | 0.0679 | |
| SRP219564 | TFAP2E | 339488 | RNAseq | 0.3507 | 0.5635 | |
| TCGA | TFAP2E | 339488 | RNAseq | 0.8320 | 0.0049 |
Upregulated datasets: 1; Downregulated datasets: 0.
Survival by TFAP2E expression:
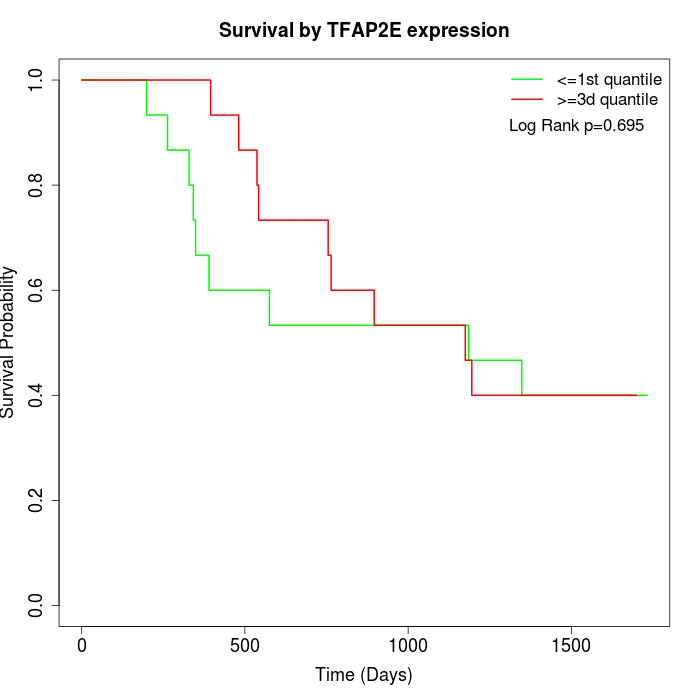 | 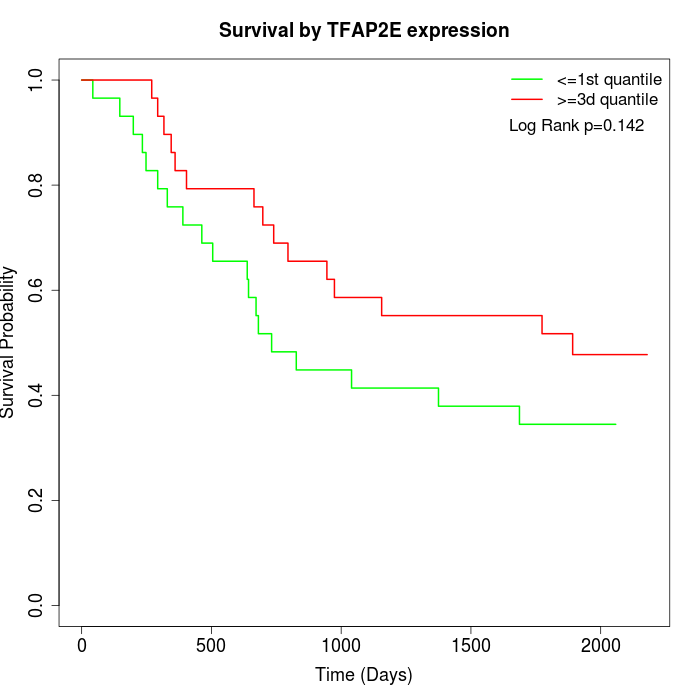 | 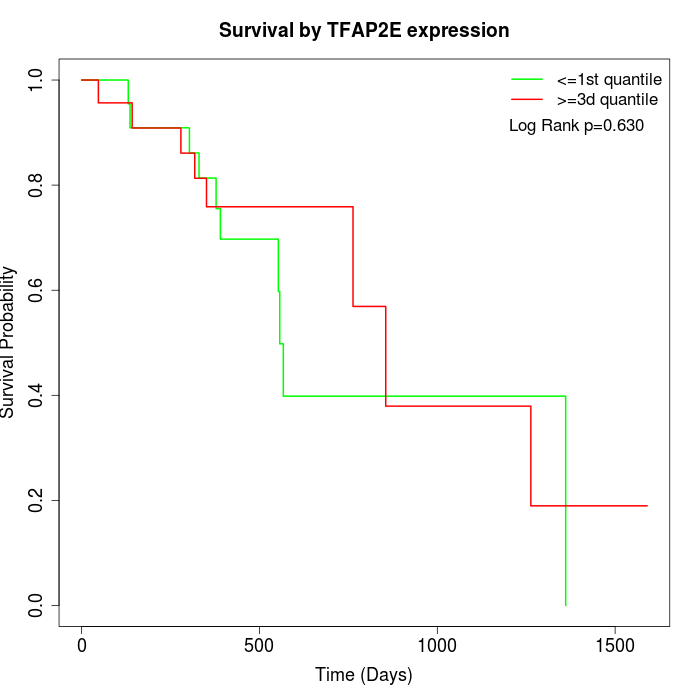 |
| GSE53622 | GSE53624 | TCGA |
Note: Click image to view full size file.
Copy number change of TFAP2E:
| Dataset | Gene | EntrezID | Gain | Loss | Normal | Detail |
|---|---|---|---|---|---|---|
| GSE15526 | TFAP2E | 339488 | 2 | 5 | 23 | |
| GSE20123 | TFAP2E | 339488 | 2 | 4 | 24 | |
| GSE43470 | TFAP2E | 339488 | 7 | 2 | 34 | |
| GSE46452 | TFAP2E | 339488 | 4 | 1 | 54 | |
| GSE47630 | TFAP2E | 339488 | 8 | 3 | 29 | |
| GSE54993 | TFAP2E | 339488 | 1 | 1 | 68 | |
| GSE54994 | TFAP2E | 339488 | 11 | 2 | 40 | |
| GSE60625 | TFAP2E | 339488 | 0 | 0 | 11 | |
| GSE74703 | TFAP2E | 339488 | 6 | 1 | 29 | |
| GSE74704 | TFAP2E | 339488 | 1 | 0 | 19 | |
| TCGA | TFAP2E | 339488 | 11 | 19 | 66 |
Total number of gains: 53; Total number of losses: 38; Total Number of normals: 397.
Somatic mutations of TFAP2E:
Generating mutation plots.
Highly correlated genes for TFAP2E:
Showing top 20/91 corelated genes with mean PCC>0.5.
| Gene1 | Gene2 | Mean PCC | Num. Datasets | Num. PCC<0 | Num. PCC>0.5 |
|---|---|---|---|---|---|
| TFAP2E | IL12RB2 | 0.817066 | 3 | 0 | 3 |
| TFAP2E | HOMER1 | 0.772181 | 3 | 0 | 3 |
| TFAP2E | TPRX1 | 0.769005 | 3 | 0 | 3 |
| TFAP2E | LTB4R2 | 0.759572 | 3 | 0 | 3 |
| TFAP2E | CLDN9 | 0.73773 | 3 | 0 | 3 |
| TFAP2E | OR51T1 | 0.727192 | 3 | 0 | 3 |
| TFAP2E | GHSR | 0.725269 | 3 | 0 | 3 |
| TFAP2E | KBTBD13 | 0.721512 | 3 | 0 | 3 |
| TFAP2E | KRTAP3-1 | 0.718299 | 3 | 0 | 3 |
| TFAP2E | SHROOM1 | 0.713364 | 3 | 0 | 3 |
| TFAP2E | FOXA3 | 0.712879 | 3 | 0 | 3 |
| TFAP2E | LHX9 | 0.710172 | 3 | 0 | 3 |
| TFAP2E | TRIM46 | 0.708551 | 4 | 0 | 4 |
| TFAP2E | MFSD2B | 0.708135 | 3 | 0 | 3 |
| TFAP2E | TFAP2C | 0.699654 | 3 | 0 | 3 |
| TFAP2E | GDF7 | 0.698504 | 3 | 0 | 3 |
| TFAP2E | PLEC | 0.697476 | 3 | 0 | 3 |
| TFAP2E | RUFY4 | 0.693339 | 3 | 0 | 3 |
| TFAP2E | KRTAP6-1 | 0.691596 | 3 | 0 | 3 |
| TFAP2E | GJB4 | 0.690819 | 3 | 0 | 3 |
For details and further investigation, click here