| Full name: SH3 and cysteine rich domain 3 | Alias Symbol: MGC2793 | ||
| Type: protein-coding gene | Cytoband: 12q13.3 | ||
| Entrez ID: 246329 | HGNC ID: HGNC:28423 | Ensembl Gene: ENSG00000185482 | OMIM ID: 615521 |
Expression of STAC3:
| Dataset | Gene | EntrezID | Probe | Log2FC | Adj.pValue | Expression |
|---|---|---|---|---|---|---|
| GSE17351 | STAC3 | 246329 | 230852_at | -0.1247 | 0.6504 | |
| GSE26886 | STAC3 | 246329 | 230852_at | 0.4150 | 0.0010 | |
| GSE45670 | STAC3 | 246329 | 230852_at | 0.1754 | 0.1162 | |
| GSE53622 | STAC3 | 246329 | 65092 | 0.1988 | 0.0044 | |
| GSE53624 | STAC3 | 246329 | 65092 | 0.2314 | 0.0006 | |
| GSE63941 | STAC3 | 246329 | 230852_at | 0.3062 | 0.0706 | |
| GSE77861 | STAC3 | 246329 | 230852_at | 0.0416 | 0.8070 | |
| GSE97050 | STAC3 | 246329 | A_33_P3220663 | -0.0913 | 0.6628 | |
| SRP064894 | STAC3 | 246329 | RNAseq | 1.6721 | 0.0000 | |
| SRP133303 | STAC3 | 246329 | RNAseq | 0.5304 | 0.0320 | |
| SRP159526 | STAC3 | 246329 | RNAseq | 0.5404 | 0.2800 | |
| SRP219564 | STAC3 | 246329 | RNAseq | 1.3736 | 0.0067 | |
| TCGA | STAC3 | 246329 | RNAseq | 1.0384 | 0.0000 |
Upregulated datasets: 3; Downregulated datasets: 0.
Survival by STAC3 expression:
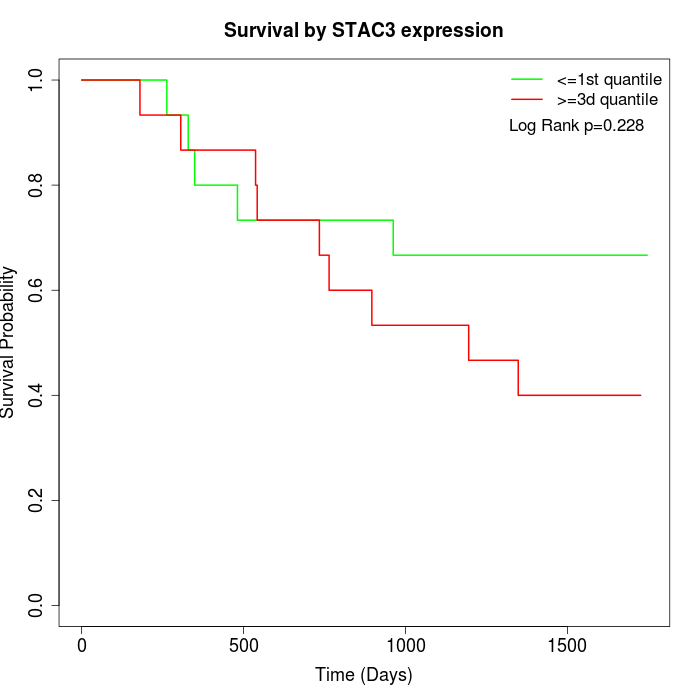 | 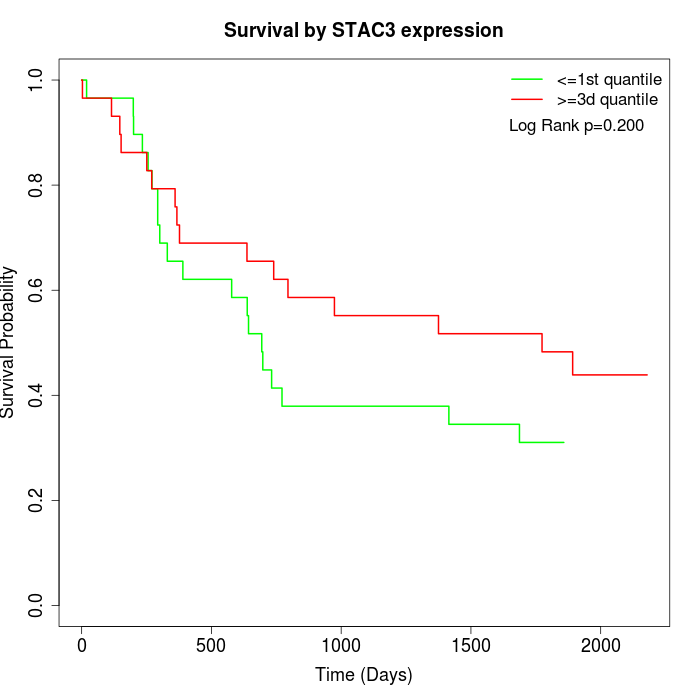 | 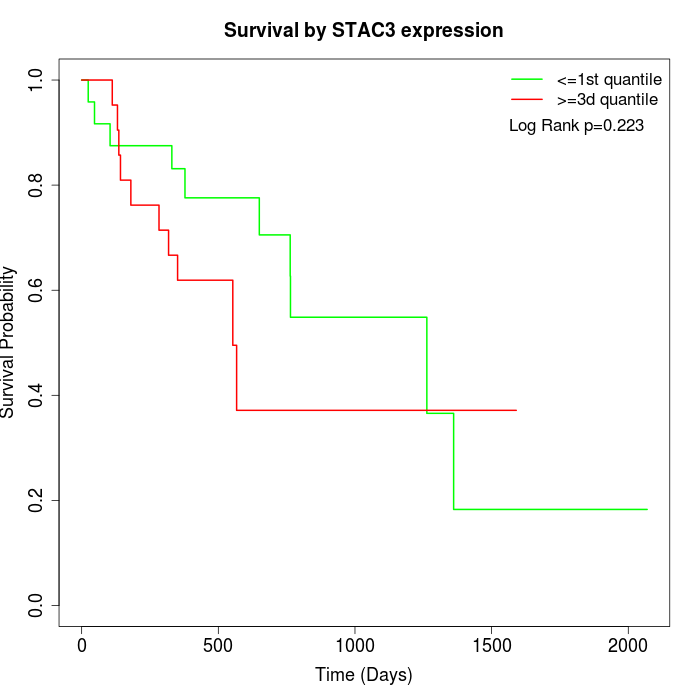 |
| GSE53622 | GSE53624 | TCGA |
Note: Click image to view full size file.
Copy number change of STAC3:
| Dataset | Gene | EntrezID | Gain | Loss | Normal | Detail |
|---|---|---|---|---|---|---|
| GSE15526 | STAC3 | 246329 | 7 | 1 | 22 | |
| GSE20123 | STAC3 | 246329 | 7 | 0 | 23 | |
| GSE43470 | STAC3 | 246329 | 2 | 0 | 41 | |
| GSE46452 | STAC3 | 246329 | 8 | 1 | 50 | |
| GSE47630 | STAC3 | 246329 | 10 | 2 | 28 | |
| GSE54993 | STAC3 | 246329 | 0 | 5 | 65 | |
| GSE54994 | STAC3 | 246329 | 4 | 1 | 48 | |
| GSE60625 | STAC3 | 246329 | 0 | 0 | 11 | |
| GSE74703 | STAC3 | 246329 | 2 | 0 | 34 | |
| GSE74704 | STAC3 | 246329 | 4 | 0 | 16 | |
| TCGA | STAC3 | 246329 | 14 | 10 | 72 |
Total number of gains: 58; Total number of losses: 20; Total Number of normals: 410.
Somatic mutations of STAC3:
Generating mutation plots.
Highly correlated genes for STAC3:
Showing top 20/462 corelated genes with mean PCC>0.5.
| Gene1 | Gene2 | Mean PCC | Num. Datasets | Num. PCC<0 | Num. PCC>0.5 |
|---|---|---|---|---|---|
| STAC3 | C1QL2 | 0.844865 | 3 | 0 | 3 |
| STAC3 | PAX6 | 0.841686 | 3 | 0 | 3 |
| STAC3 | GRIK4 | 0.81422 | 3 | 0 | 3 |
| STAC3 | ZNF446 | 0.80458 | 3 | 0 | 3 |
| STAC3 | SLC22A7 | 0.79685 | 3 | 0 | 3 |
| STAC3 | C9orf153 | 0.796701 | 3 | 0 | 3 |
| STAC3 | DCDC1 | 0.791786 | 3 | 0 | 3 |
| STAC3 | ZNF428 | 0.7813 | 3 | 0 | 3 |
| STAC3 | RETN | 0.780183 | 5 | 0 | 5 |
| STAC3 | PRSS38 | 0.777093 | 3 | 0 | 3 |
| STAC3 | BBC3 | 0.776653 | 3 | 0 | 3 |
| STAC3 | C2CD4D | 0.775779 | 3 | 0 | 3 |
| STAC3 | YY2 | 0.772071 | 3 | 0 | 3 |
| STAC3 | MOS | 0.770188 | 3 | 0 | 3 |
| STAC3 | DRGX | 0.769632 | 3 | 0 | 3 |
| STAC3 | LTB4R2 | 0.768559 | 4 | 0 | 3 |
| STAC3 | FAM177B | 0.764069 | 3 | 0 | 3 |
| STAC3 | PPP1R12C | 0.763809 | 3 | 0 | 3 |
| STAC3 | SHC2 | 0.763732 | 3 | 0 | 3 |
| STAC3 | KLRG2 | 0.762448 | 3 | 0 | 3 |
For details and further investigation, click here