| Full name: microtubule associated monooxygenase, calponin and LIM domain containing 3 | Alias Symbol: KIAA0819 | ||
| Type: protein-coding gene | Cytoband: 22q11.21 | ||
| Entrez ID: 57553 | HGNC ID: HGNC:24694 | Ensembl Gene: ENSG00000243156 | OMIM ID: 608882 |
Expression of MICAL3:
| Dataset | Gene | EntrezID | Probe | Log2FC | Adj.pValue | Expression |
|---|---|---|---|---|---|---|
| GSE17351 | MICAL3 | 57553 | 212715_s_at | 0.1853 | 0.7856 | |
| GSE20347 | MICAL3 | 57553 | 212715_s_at | 0.7851 | 0.0000 | |
| GSE23400 | MICAL3 | 57553 | 212715_s_at | 0.2661 | 0.0031 | |
| GSE26886 | MICAL3 | 57553 | 231553_s_at | 0.3635 | 0.0003 | |
| GSE29001 | MICAL3 | 57553 | 212715_s_at | 0.4946 | 0.0626 | |
| GSE38129 | MICAL3 | 57553 | 212715_s_at | 0.5492 | 0.0299 | |
| GSE45670 | MICAL3 | 57553 | 212715_s_at | 0.4038 | 0.1205 | |
| GSE53622 | MICAL3 | 57553 | 115217 | 0.6811 | 0.0000 | |
| GSE53624 | MICAL3 | 57553 | 115217 | 0.7763 | 0.0000 | |
| GSE63941 | MICAL3 | 57553 | 231553_s_at | 0.2713 | 0.0890 | |
| GSE77861 | MICAL3 | 57553 | 231553_s_at | 0.0821 | 0.4659 | |
| GSE97050 | MICAL3 | 57553 | A_33_P3267822 | 0.0059 | 0.9846 | |
| SRP007169 | MICAL3 | 57553 | RNAseq | 2.6515 | 0.0000 | |
| SRP008496 | MICAL3 | 57553 | RNAseq | 2.6946 | 0.0000 | |
| SRP064894 | MICAL3 | 57553 | RNAseq | 0.4573 | 0.0583 | |
| SRP133303 | MICAL3 | 57553 | RNAseq | 0.3371 | 0.0826 | |
| SRP159526 | MICAL3 | 57553 | RNAseq | 0.3081 | 0.3649 | |
| SRP193095 | MICAL3 | 57553 | RNAseq | 0.9613 | 0.0000 | |
| SRP219564 | MICAL3 | 57553 | RNAseq | 0.1179 | 0.8001 | |
| TCGA | MICAL3 | 57553 | RNAseq | 0.0904 | 0.1601 |
Upregulated datasets: 2; Downregulated datasets: 0.
Survival by MICAL3 expression:
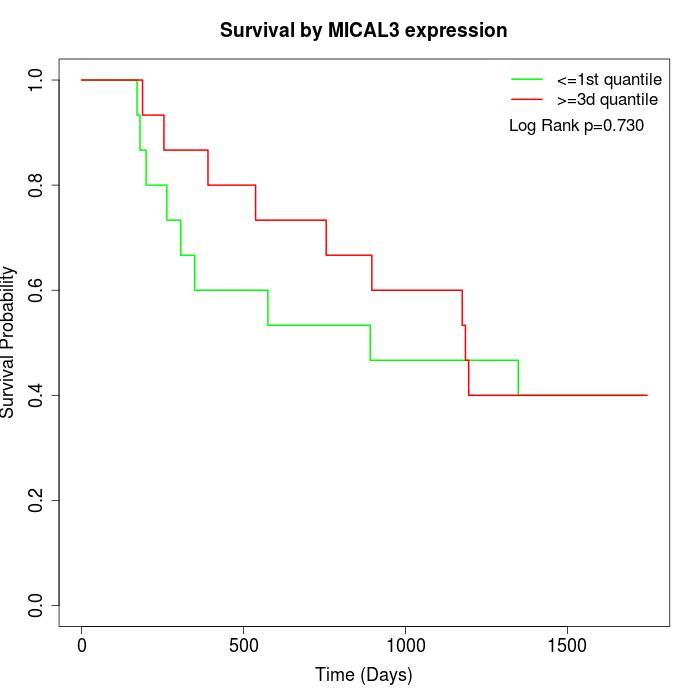 | 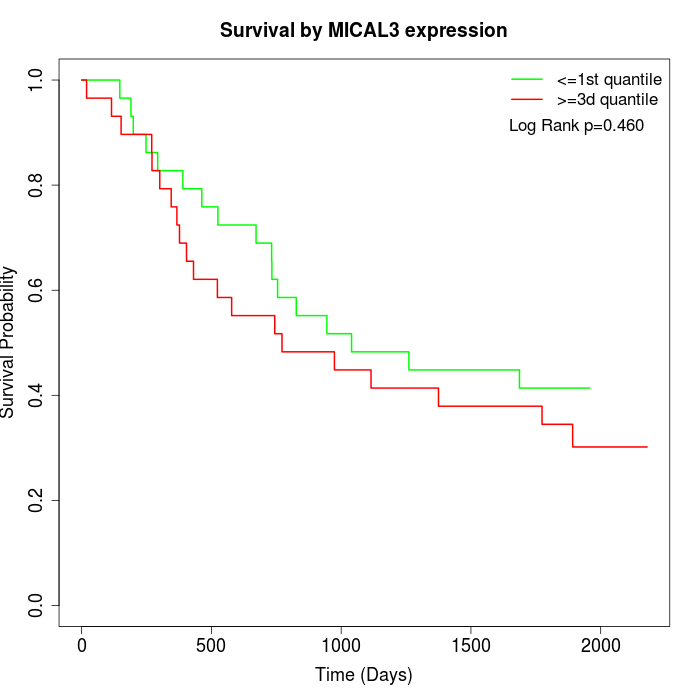 | 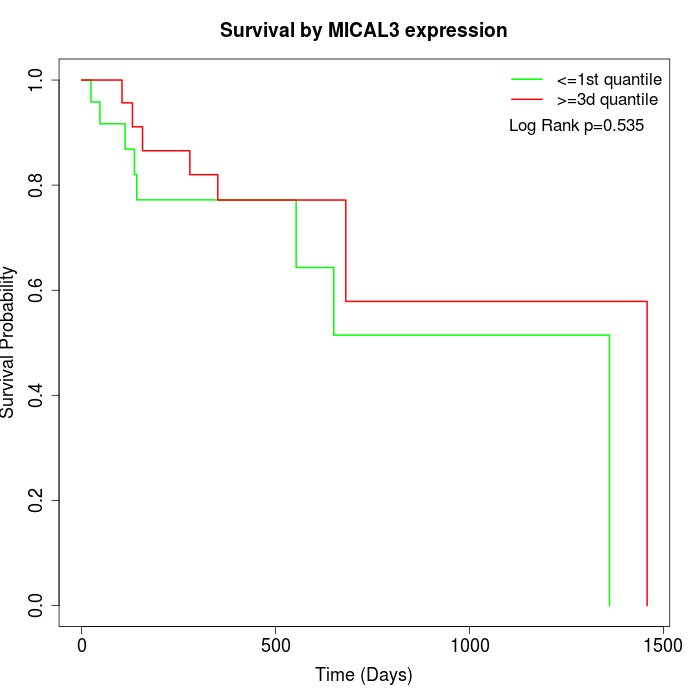 |
| GSE53622 | GSE53624 | TCGA |
Note: Click image to view full size file.
Copy number change of MICAL3:
| Dataset | Gene | EntrezID | Gain | Loss | Normal | Detail |
|---|---|---|---|---|---|---|
| GSE15526 | MICAL3 | 57553 | 4 | 7 | 19 | |
| GSE20123 | MICAL3 | 57553 | 4 | 7 | 19 | |
| GSE43470 | MICAL3 | 57553 | 5 | 7 | 31 | |
| GSE46452 | MICAL3 | 57553 | 32 | 2 | 25 | |
| GSE47630 | MICAL3 | 57553 | 8 | 5 | 27 | |
| GSE54993 | MICAL3 | 57553 | 3 | 6 | 61 | |
| GSE54994 | MICAL3 | 57553 | 13 | 7 | 33 | |
| GSE60625 | MICAL3 | 57553 | 5 | 0 | 6 | |
| GSE74703 | MICAL3 | 57553 | 5 | 5 | 26 | |
| GSE74704 | MICAL3 | 57553 | 2 | 4 | 14 | |
| TCGA | MICAL3 | 57553 | 26 | 17 | 53 |
Total number of gains: 107; Total number of losses: 67; Total Number of normals: 314.
Somatic mutations of MICAL3:
Generating mutation plots.
Highly correlated genes for MICAL3:
Showing top 20/674 corelated genes with mean PCC>0.5.
| Gene1 | Gene2 | Mean PCC | Num. Datasets | Num. PCC<0 | Num. PCC>0.5 |
|---|---|---|---|---|---|
| MICAL3 | ZBED3 | 0.663665 | 3 | 0 | 3 |
| MICAL3 | NR1H2 | 0.663619 | 3 | 0 | 3 |
| MICAL3 | TBX18 | 0.649266 | 4 | 0 | 3 |
| MICAL3 | PFKM | 0.647577 | 6 | 0 | 5 |
| MICAL3 | ACD | 0.646331 | 8 | 0 | 6 |
| MICAL3 | GNAI2 | 0.644717 | 5 | 0 | 4 |
| MICAL3 | RILPL1 | 0.637532 | 5 | 0 | 4 |
| MICAL3 | RPRD2 | 0.630362 | 3 | 0 | 3 |
| MICAL3 | ZC3H18 | 0.628165 | 3 | 0 | 3 |
| MICAL3 | CNTD1 | 0.6274 | 4 | 0 | 3 |
| MICAL3 | PRELID2 | 0.625627 | 5 | 0 | 3 |
| MICAL3 | SLC39A3 | 0.622976 | 4 | 0 | 4 |
| MICAL3 | NFAM1 | 0.622604 | 3 | 0 | 3 |
| MICAL3 | RHOQ | 0.621786 | 8 | 0 | 6 |
| MICAL3 | DMXL2 | 0.621698 | 4 | 0 | 3 |
| MICAL3 | FCER1G | 0.620671 | 4 | 0 | 4 |
| MICAL3 | GOLM1 | 0.620032 | 4 | 0 | 3 |
| MICAL3 | CMTM8 | 0.61791 | 3 | 0 | 3 |
| MICAL3 | FEZ1 | 0.614592 | 7 | 0 | 5 |
| MICAL3 | NENF | 0.614451 | 7 | 0 | 6 |
For details and further investigation, click here