| Full name: mitochondrial intermediate peptidase | Alias Symbol: MIP | ||
| Type: protein-coding gene | Cytoband: 13q12.12 | ||
| Entrez ID: 4285 | HGNC ID: HGNC:7104 | Ensembl Gene: ENSG00000027001 | OMIM ID: 602241 |
Screen Evidence:
| |||
Expression of MIPEP:
| Dataset | Gene | EntrezID | Probe | Log2FC | Adj.pValue | Expression |
|---|---|---|---|---|---|---|
| GSE17351 | MIPEP | 4285 | 204305_at | -0.5375 | 0.3334 | |
| GSE20347 | MIPEP | 4285 | 204305_at | -0.5686 | 0.0001 | |
| GSE23400 | MIPEP | 4285 | 204305_at | -0.2734 | 0.0000 | |
| GSE26886 | MIPEP | 4285 | 204305_at | -0.6795 | 0.0017 | |
| GSE29001 | MIPEP | 4285 | 36830_at | -0.6087 | 0.1168 | |
| GSE38129 | MIPEP | 4285 | 204305_at | -0.4503 | 0.0003 | |
| GSE45670 | MIPEP | 4285 | 204305_at | -0.3322 | 0.0097 | |
| GSE53622 | MIPEP | 4285 | 142943 | -0.4661 | 0.0000 | |
| GSE53624 | MIPEP | 4285 | 142943 | -0.4260 | 0.0000 | |
| GSE63941 | MIPEP | 4285 | 36830_at | -0.3791 | 0.4775 | |
| GSE77861 | MIPEP | 4285 | 204305_at | -0.2938 | 0.2992 | |
| GSE97050 | MIPEP | 4285 | A_33_P3404411 | -0.1003 | 0.6443 | |
| SRP007169 | MIPEP | 4285 | RNAseq | -1.2377 | 0.0007 | |
| SRP008496 | MIPEP | 4285 | RNAseq | -0.8327 | 0.0039 | |
| SRP064894 | MIPEP | 4285 | RNAseq | -0.3978 | 0.0039 | |
| SRP133303 | MIPEP | 4285 | RNAseq | -0.3975 | 0.0135 | |
| SRP159526 | MIPEP | 4285 | RNAseq | -0.5426 | 0.0894 | |
| SRP193095 | MIPEP | 4285 | RNAseq | -0.7495 | 0.0000 | |
| SRP219564 | MIPEP | 4285 | RNAseq | -0.6407 | 0.0413 | |
| TCGA | MIPEP | 4285 | RNAseq | -0.0748 | 0.2406 |
Upregulated datasets: 0; Downregulated datasets: 1.
Survival by MIPEP expression:
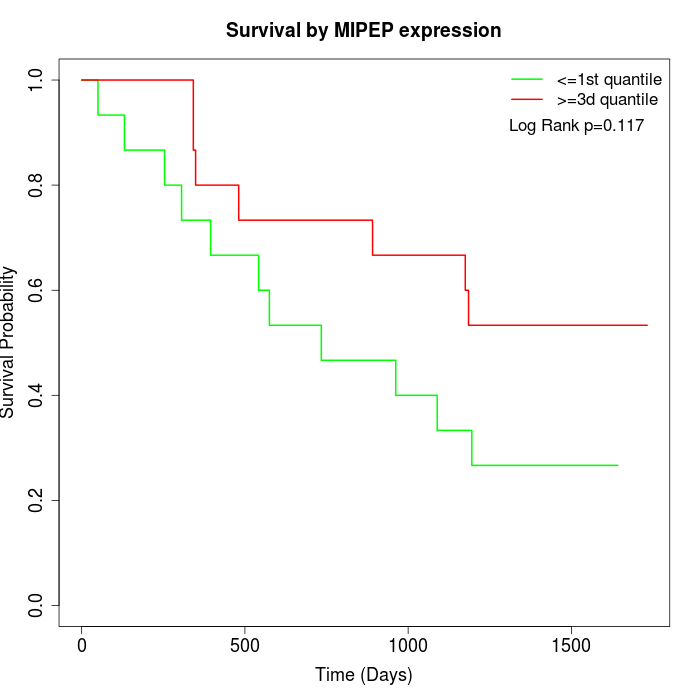 | 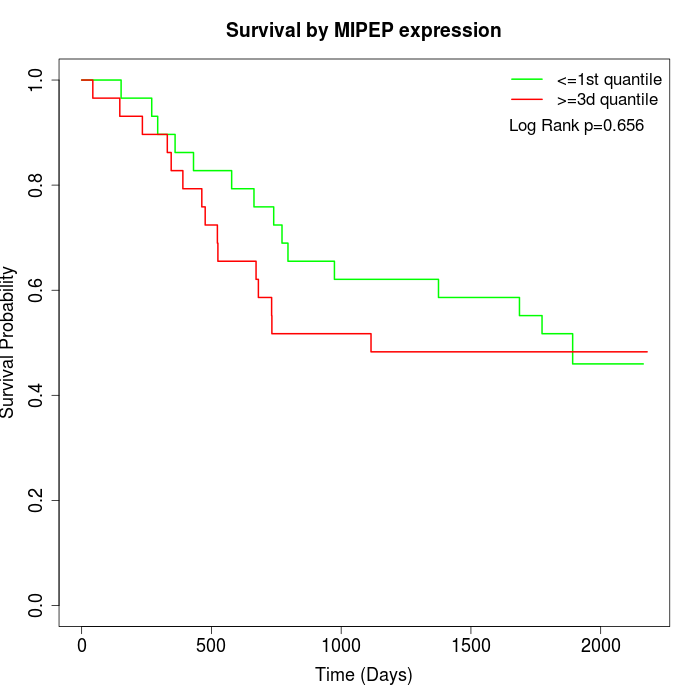 | 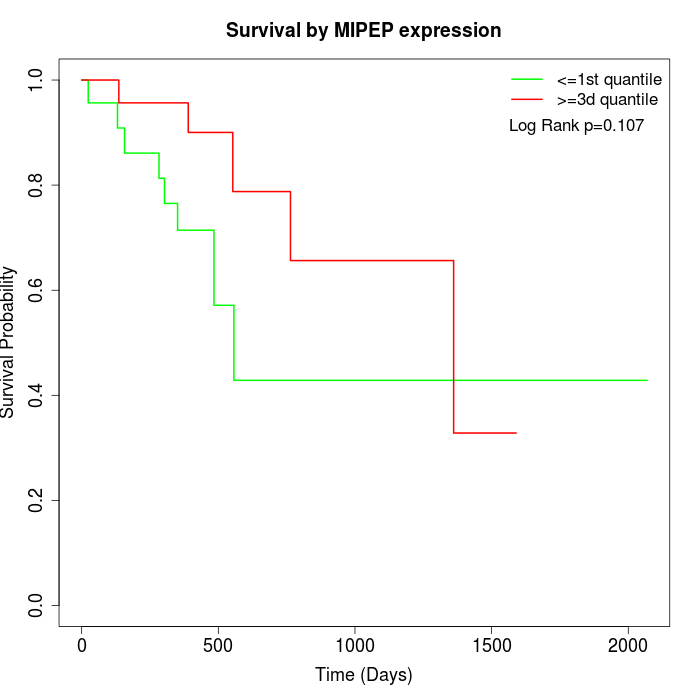 |
| GSE53622 | GSE53624 | TCGA |
Note: Click image to view full size file.
Copy number change of MIPEP:
| Dataset | Gene | EntrezID | Gain | Loss | Normal | Detail |
|---|---|---|---|---|---|---|
| GSE15526 | MIPEP | 4285 | 1 | 13 | 16 | |
| GSE20123 | MIPEP | 4285 | 1 | 12 | 17 | |
| GSE43470 | MIPEP | 4285 | 2 | 13 | 28 | |
| GSE46452 | MIPEP | 4285 | 0 | 33 | 26 | |
| GSE47630 | MIPEP | 4285 | 3 | 26 | 11 | |
| GSE54993 | MIPEP | 4285 | 11 | 2 | 57 | |
| GSE54994 | MIPEP | 4285 | 1 | 13 | 39 | |
| GSE60625 | MIPEP | 4285 | 0 | 3 | 8 | |
| GSE74703 | MIPEP | 4285 | 2 | 10 | 24 | |
| GSE74704 | MIPEP | 4285 | 0 | 10 | 10 | |
| TCGA | MIPEP | 4285 | 7 | 44 | 45 |
Total number of gains: 28; Total number of losses: 179; Total Number of normals: 281.
Somatic mutations of MIPEP:
Generating mutation plots.
Highly correlated genes for MIPEP:
Showing top 20/828 corelated genes with mean PCC>0.5.
| Gene1 | Gene2 | Mean PCC | Num. Datasets | Num. PCC<0 | Num. PCC>0.5 |
|---|---|---|---|---|---|
| MIPEP | PRPF38A | 0.81594 | 3 | 0 | 3 |
| MIPEP | WDFY1 | 0.755713 | 3 | 0 | 3 |
| MIPEP | ANKRD13A | 0.750631 | 3 | 0 | 3 |
| MIPEP | SYPL1 | 0.749923 | 4 | 0 | 4 |
| MIPEP | ACTR2 | 0.743872 | 3 | 0 | 3 |
| MIPEP | PLCD3 | 0.73414 | 3 | 0 | 3 |
| MIPEP | KIAA0355 | 0.732248 | 3 | 0 | 3 |
| MIPEP | SLTM | 0.722824 | 4 | 0 | 4 |
| MIPEP | FAHD1 | 0.719923 | 3 | 0 | 3 |
| MIPEP | TATDN2 | 0.712585 | 4 | 0 | 3 |
| MIPEP | CD2BP2 | 0.707278 | 4 | 0 | 3 |
| MIPEP | TNRC6B | 0.702366 | 3 | 0 | 3 |
| MIPEP | KAT7 | 0.700056 | 5 | 0 | 4 |
| MIPEP | SMARCAD1 | 0.698019 | 3 | 0 | 3 |
| MIPEP | C15orf41 | 0.697748 | 5 | 0 | 4 |
| MIPEP | SBF2 | 0.696122 | 5 | 0 | 5 |
| MIPEP | LYSMD3 | 0.694642 | 3 | 0 | 3 |
| MIPEP | ACTR1A | 0.692636 | 4 | 0 | 4 |
| MIPEP | HOOK3 | 0.686426 | 4 | 0 | 3 |
| MIPEP | MRPS11 | 0.68144 | 3 | 0 | 3 |
For details and further investigation, click here