| Full name: microtubule interacting and trafficking domain containing 1 | Alias Symbol: LOC129531 | ||
| Type: protein-coding gene | Cytoband: 2q11.2 | ||
| Entrez ID: 129531 | HGNC ID: HGNC:25207 | Ensembl Gene: ENSG00000158411 | OMIM ID: |
Expression of MITD1:
| Dataset | Gene | EntrezID | Probe | Log2FC | Adj.pValue | Expression |
|---|---|---|---|---|---|---|
| GSE17351 | MITD1 | 129531 | 226329_s_at | -0.0139 | 0.9822 | |
| GSE26886 | MITD1 | 129531 | 226329_s_at | 0.2458 | 0.4912 | |
| GSE45670 | MITD1 | 129531 | 226329_s_at | 0.1759 | 0.3011 | |
| GSE53622 | MITD1 | 129531 | 81875 | 0.0066 | 0.9293 | |
| GSE53624 | MITD1 | 129531 | 81875 | 0.0882 | 0.1104 | |
| GSE63941 | MITD1 | 129531 | 226329_s_at | 0.5221 | 0.2153 | |
| GSE77861 | MITD1 | 129531 | 226329_s_at | 0.0249 | 0.9568 | |
| GSE97050 | MITD1 | 129531 | A_33_P3379506 | 0.0414 | 0.9076 | |
| SRP007169 | MITD1 | 129531 | RNAseq | -0.3466 | 0.3765 | |
| SRP008496 | MITD1 | 129531 | RNAseq | -0.2489 | 0.3983 | |
| SRP064894 | MITD1 | 129531 | RNAseq | 0.1601 | 0.2812 | |
| SRP133303 | MITD1 | 129531 | RNAseq | 0.2177 | 0.1367 | |
| SRP159526 | MITD1 | 129531 | RNAseq | -0.0952 | 0.7388 | |
| SRP193095 | MITD1 | 129531 | RNAseq | -0.2446 | 0.0240 | |
| SRP219564 | MITD1 | 129531 | RNAseq | 0.2006 | 0.5032 | |
| TCGA | MITD1 | 129531 | RNAseq | 0.3087 | 0.0001 |
Upregulated datasets: 0; Downregulated datasets: 0.
Survival by MITD1 expression:
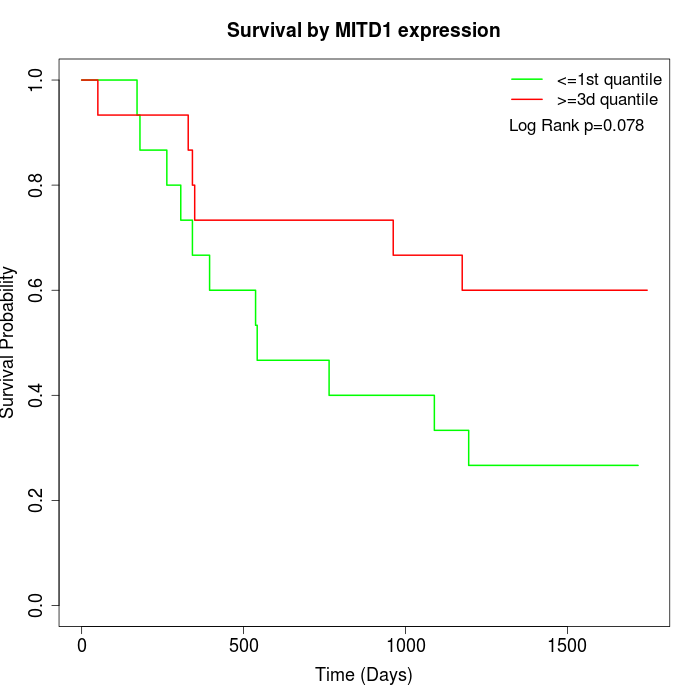 | 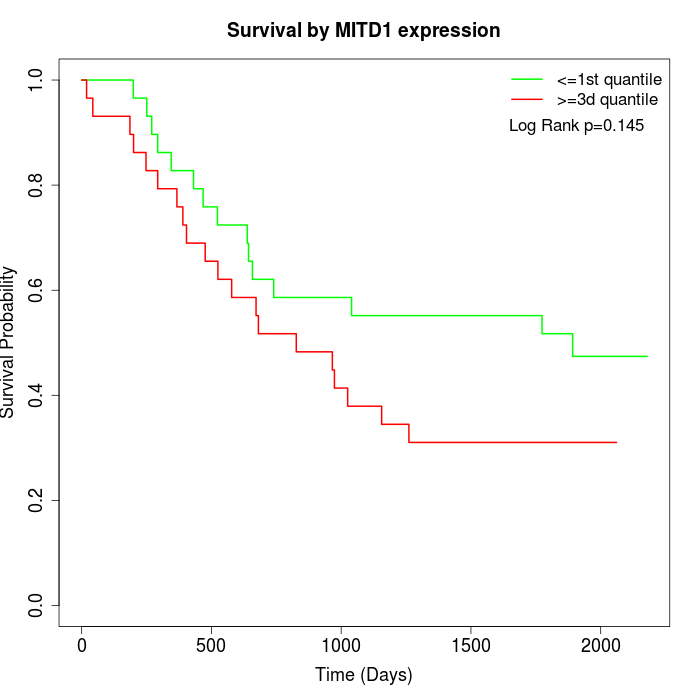 | 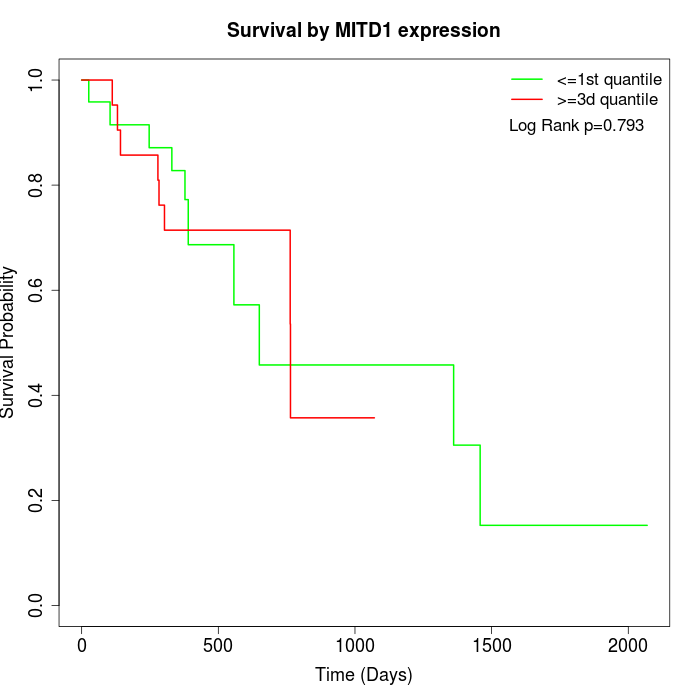 |
| GSE53622 | GSE53624 | TCGA |
Note: Click image to view full size file.
Copy number change of MITD1:
| Dataset | Gene | EntrezID | Gain | Loss | Normal | Detail |
|---|---|---|---|---|---|---|
| GSE15526 | MITD1 | 129531 | 6 | 2 | 22 | |
| GSE20123 | MITD1 | 129531 | 6 | 2 | 22 | |
| GSE43470 | MITD1 | 129531 | 3 | 1 | 39 | |
| GSE46452 | MITD1 | 129531 | 2 | 3 | 54 | |
| GSE47630 | MITD1 | 129531 | 7 | 0 | 33 | |
| GSE54993 | MITD1 | 129531 | 0 | 6 | 64 | |
| GSE54994 | MITD1 | 129531 | 10 | 0 | 43 | |
| GSE60625 | MITD1 | 129531 | 0 | 3 | 8 | |
| GSE74703 | MITD1 | 129531 | 3 | 1 | 32 | |
| GSE74704 | MITD1 | 129531 | 4 | 1 | 15 | |
| TCGA | MITD1 | 129531 | 34 | 4 | 58 |
Total number of gains: 75; Total number of losses: 23; Total Number of normals: 390.
Somatic mutations of MITD1:
Generating mutation plots.
Highly correlated genes for MITD1:
Showing top 20/309 corelated genes with mean PCC>0.5.
| Gene1 | Gene2 | Mean PCC | Num. Datasets | Num. PCC<0 | Num. PCC>0.5 |
|---|---|---|---|---|---|
| MITD1 | CCDC25 | 0.765987 | 3 | 0 | 3 |
| MITD1 | ANKRD13C | 0.765006 | 4 | 0 | 4 |
| MITD1 | UBE4A | 0.758669 | 4 | 0 | 4 |
| MITD1 | ACBD5 | 0.755727 | 3 | 0 | 3 |
| MITD1 | RSRC2 | 0.752661 | 3 | 0 | 3 |
| MITD1 | TMTC3 | 0.748303 | 3 | 0 | 3 |
| MITD1 | MRPL42 | 0.747225 | 3 | 0 | 3 |
| MITD1 | NPAT | 0.74716 | 3 | 0 | 3 |
| MITD1 | NUDT15 | 0.746008 | 3 | 0 | 3 |
| MITD1 | STAM2 | 0.742996 | 3 | 0 | 3 |
| MITD1 | GFM2 | 0.740794 | 3 | 0 | 3 |
| MITD1 | USP32 | 0.738422 | 3 | 0 | 3 |
| MITD1 | SLC38A9 | 0.737018 | 3 | 0 | 3 |
| MITD1 | ARPC3 | 0.734148 | 3 | 0 | 3 |
| MITD1 | PDZD8 | 0.729203 | 3 | 0 | 3 |
| MITD1 | CBFA2T2 | 0.728231 | 3 | 0 | 3 |
| MITD1 | SLC35F5 | 0.725778 | 3 | 0 | 3 |
| MITD1 | MRPS11 | 0.715665 | 3 | 0 | 3 |
| MITD1 | EIF4E | 0.71528 | 4 | 0 | 3 |
| MITD1 | RPS6KB1 | 0.714715 | 3 | 0 | 3 |
For details and further investigation, click here