| Full name: signal transducing adaptor molecule 2 | Alias Symbol: Hbp | ||
| Type: protein-coding gene | Cytoband: 2q23.3 | ||
| Entrez ID: 10254 | HGNC ID: HGNC:11358 | Ensembl Gene: ENSG00000115145 | OMIM ID: 606244 |
STAM2 involved pathways:
| KEGG pathway | Description | View |
|---|---|---|
| hsa04630 | Jak-STAT signaling pathway |
Expression of STAM2:
| Dataset | Gene | EntrezID | Probe | Log2FC | Adj.pValue | Expression |
|---|---|---|---|---|---|---|
| GSE17351 | STAM2 | 10254 | 209649_at | -0.1415 | 0.6775 | |
| GSE20347 | STAM2 | 10254 | 209649_at | -0.4915 | 0.0001 | |
| GSE23400 | STAM2 | 10254 | 209649_at | 0.0266 | 0.7151 | |
| GSE26886 | STAM2 | 10254 | 228254_at | -0.2537 | 0.2011 | |
| GSE29001 | STAM2 | 10254 | 209649_at | -0.4988 | 0.3687 | |
| GSE38129 | STAM2 | 10254 | 209649_at | -0.2387 | 0.0060 | |
| GSE45670 | STAM2 | 10254 | 209649_at | -0.0260 | 0.8663 | |
| GSE53622 | STAM2 | 10254 | 19358 | -0.3124 | 0.0004 | |
| GSE53624 | STAM2 | 10254 | 19358 | -0.2943 | 0.0005 | |
| GSE63941 | STAM2 | 10254 | 209649_at | -1.0181 | 0.0712 | |
| GSE77861 | STAM2 | 10254 | 209649_at | -0.2413 | 0.4107 | |
| GSE97050 | STAM2 | 10254 | A_24_P62860 | 0.1820 | 0.4079 | |
| SRP007169 | STAM2 | 10254 | RNAseq | -0.8841 | 0.0052 | |
| SRP008496 | STAM2 | 10254 | RNAseq | -0.8159 | 0.0000 | |
| SRP064894 | STAM2 | 10254 | RNAseq | -0.3660 | 0.0998 | |
| SRP133303 | STAM2 | 10254 | RNAseq | -0.0179 | 0.9028 | |
| SRP159526 | STAM2 | 10254 | RNAseq | -0.6522 | 0.0226 | |
| SRP193095 | STAM2 | 10254 | RNAseq | -0.6135 | 0.0000 | |
| SRP219564 | STAM2 | 10254 | RNAseq | -0.5071 | 0.1407 | |
| TCGA | STAM2 | 10254 | RNAseq | -0.1945 | 0.0000 |
Upregulated datasets: 0; Downregulated datasets: 0.
Survival by STAM2 expression:
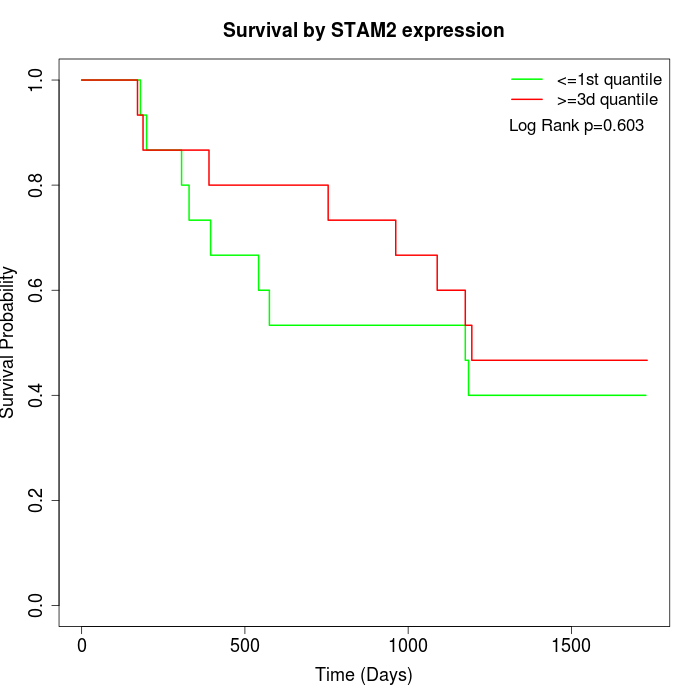 | 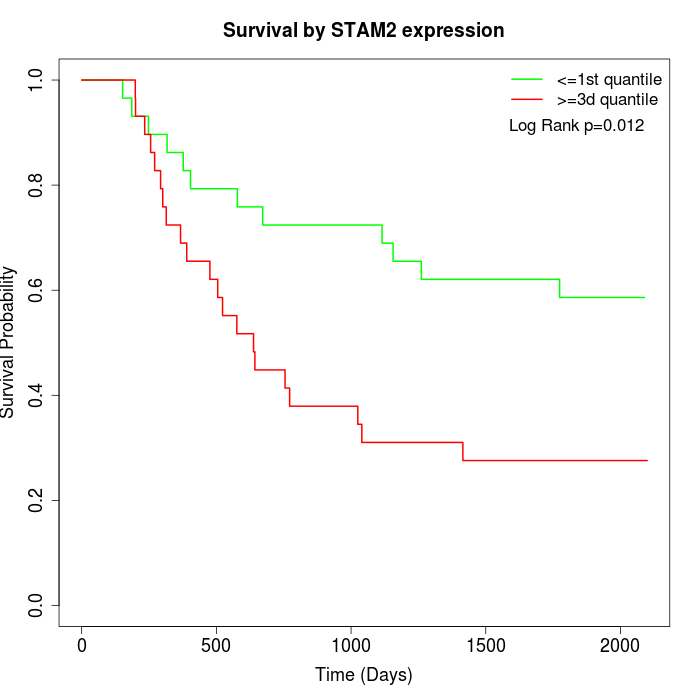 | 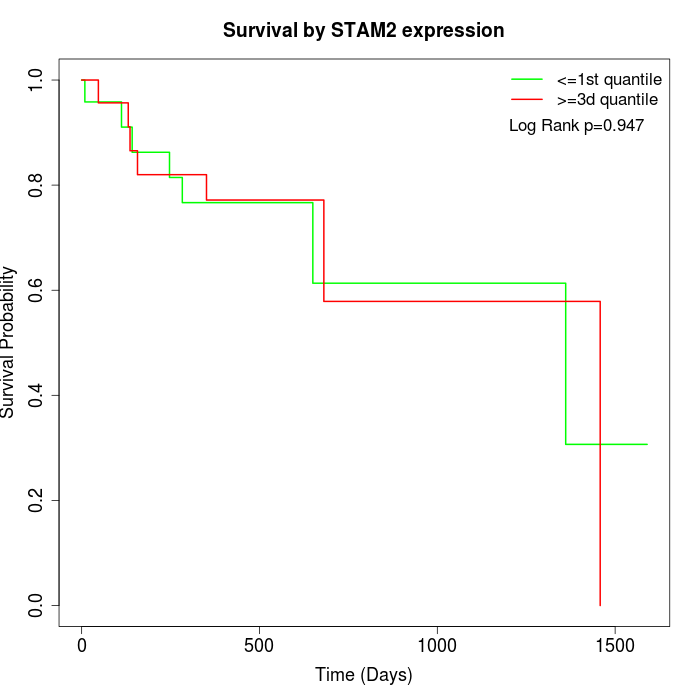 |
| GSE53622 | GSE53624 | TCGA |
Note: Click image to view full size file.
Copy number change of STAM2:
| Dataset | Gene | EntrezID | Gain | Loss | Normal | Detail |
|---|---|---|---|---|---|---|
| GSE15526 | STAM2 | 10254 | 3 | 2 | 25 | |
| GSE20123 | STAM2 | 10254 | 3 | 2 | 25 | |
| GSE43470 | STAM2 | 10254 | 3 | 1 | 39 | |
| GSE46452 | STAM2 | 10254 | 1 | 4 | 54 | |
| GSE47630 | STAM2 | 10254 | 5 | 3 | 32 | |
| GSE54993 | STAM2 | 10254 | 0 | 5 | 65 | |
| GSE54994 | STAM2 | 10254 | 11 | 2 | 40 | |
| GSE60625 | STAM2 | 10254 | 0 | 3 | 8 | |
| GSE74703 | STAM2 | 10254 | 2 | 1 | 33 | |
| GSE74704 | STAM2 | 10254 | 2 | 0 | 18 | |
| TCGA | STAM2 | 10254 | 21 | 8 | 67 |
Total number of gains: 51; Total number of losses: 31; Total Number of normals: 406.
Somatic mutations of STAM2:
Generating mutation plots.
Highly correlated genes for STAM2:
Showing top 20/850 corelated genes with mean PCC>0.5.
| Gene1 | Gene2 | Mean PCC | Num. Datasets | Num. PCC<0 | Num. PCC>0.5 |
|---|---|---|---|---|---|
| STAM2 | PDZD11 | 0.774312 | 3 | 0 | 3 |
| STAM2 | C9orf85 | 0.760858 | 3 | 0 | 3 |
| STAM2 | ACAP2 | 0.758554 | 4 | 0 | 4 |
| STAM2 | WDFY2 | 0.750841 | 3 | 0 | 3 |
| STAM2 | SPPL3 | 0.743832 | 3 | 0 | 3 |
| STAM2 | ZNF518A | 0.743141 | 3 | 0 | 3 |
| STAM2 | MITD1 | 0.742996 | 3 | 0 | 3 |
| STAM2 | ACBD5 | 0.736319 | 3 | 0 | 3 |
| STAM2 | MNS1 | 0.734009 | 3 | 0 | 3 |
| STAM2 | EIF2S2 | 0.733473 | 4 | 0 | 4 |
| STAM2 | BRD8 | 0.729231 | 3 | 0 | 3 |
| STAM2 | TOR1AIP2 | 0.728978 | 3 | 0 | 3 |
| STAM2 | ABCB10 | 0.718968 | 3 | 0 | 3 |
| STAM2 | MPHOSPH10 | 0.710522 | 4 | 0 | 3 |
| STAM2 | NUDT9 | 0.707446 | 4 | 0 | 3 |
| STAM2 | SNX4 | 0.70531 | 4 | 0 | 3 |
| STAM2 | BRWD1 | 0.703618 | 4 | 0 | 3 |
| STAM2 | UBE3A | 0.702062 | 3 | 0 | 3 |
| STAM2 | TXNL1 | 0.698285 | 3 | 0 | 3 |
| STAM2 | OSBPL8 | 0.697585 | 5 | 0 | 4 |
For details and further investigation, click here