| Full name: misato mitochondrial distribution and morphology regulator 1 | Alias Symbol: FLJ10504|LST005|MST|misato | ||
| Type: protein-coding gene | Cytoband: 1q22 | ||
| Entrez ID: 55154 | HGNC ID: HGNC:29678 | Ensembl Gene: ENSG00000125459 | OMIM ID: 617619 |
Screen Evidence:
| |||
Expression of MSTO1:
| Dataset | Gene | EntrezID | Probe | Log2FC | Adj.pValue | Expression |
|---|---|---|---|---|---|---|
| GSE17351 | MSTO1 | 55154 | 222584_at | 0.9653 | 0.0878 | |
| GSE26886 | MSTO1 | 55154 | 222584_at | 1.0737 | 0.0000 | |
| GSE45670 | MSTO1 | 55154 | 222584_at | 0.3929 | 0.0467 | |
| GSE53622 | MSTO1 | 55154 | 165279 | 0.4294 | 0.0000 | |
| GSE53624 | MSTO1 | 55154 | 165279 | 0.6462 | 0.0000 | |
| GSE63941 | MSTO1 | 55154 | 222584_at | -0.0871 | 0.7967 | |
| GSE77861 | MSTO1 | 55154 | 222584_at | 0.6542 | 0.0067 | |
| GSE97050 | MSTO1 | 55154 | A_33_P3333527 | 0.4514 | 0.1594 | |
| SRP007169 | MSTO1 | 55154 | RNAseq | 0.0492 | 0.9110 | |
| SRP008496 | MSTO1 | 55154 | RNAseq | 0.0885 | 0.7870 | |
| SRP064894 | MSTO1 | 55154 | RNAseq | 0.5603 | 0.0004 | |
| SRP133303 | MSTO1 | 55154 | RNAseq | 0.6180 | 0.0117 | |
| SRP159526 | MSTO1 | 55154 | RNAseq | 1.3691 | 0.0007 | |
| SRP193095 | MSTO1 | 55154 | RNAseq | 0.5657 | 0.0000 | |
| SRP219564 | MSTO1 | 55154 | RNAseq | 0.9205 | 0.0402 | |
| TCGA | MSTO1 | 55154 | RNAseq | 0.1408 | 0.0184 |
Upregulated datasets: 2; Downregulated datasets: 0.
Survival by MSTO1 expression:
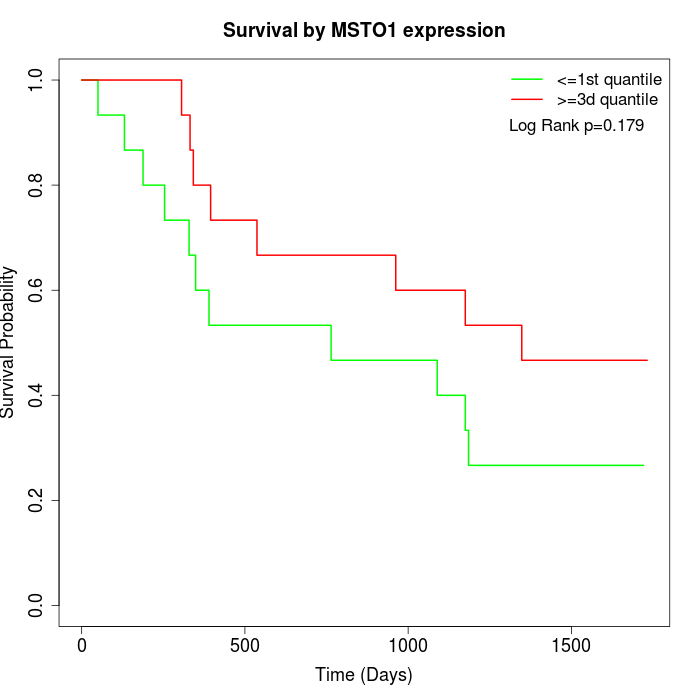 | 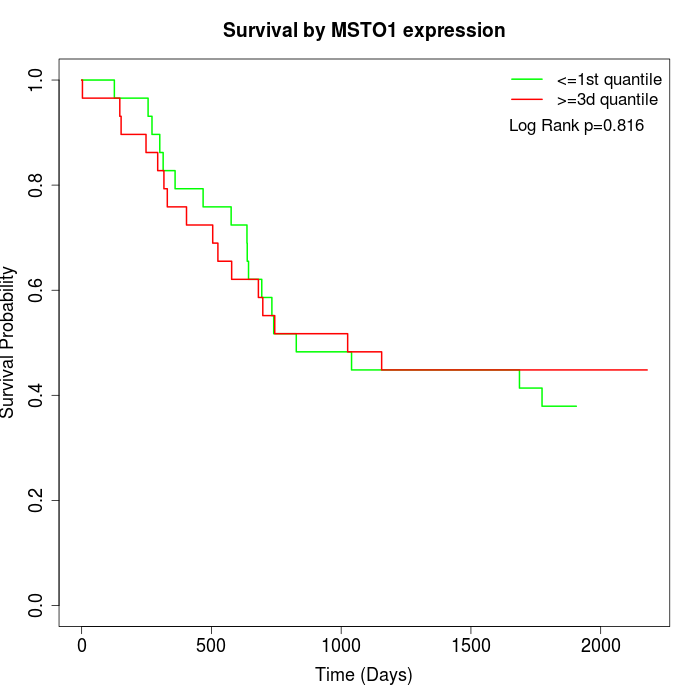 | 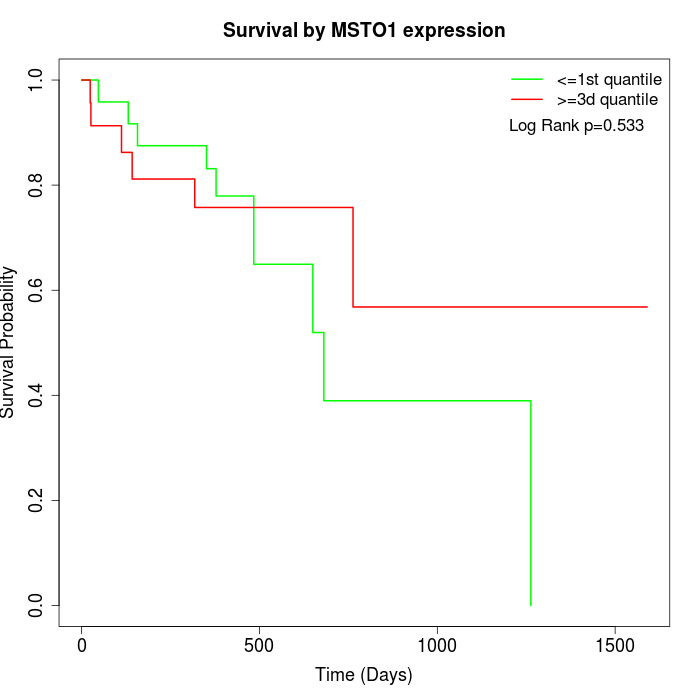 |
| GSE53622 | GSE53624 | TCGA |
Note: Click image to view full size file.
Copy number change of MSTO1:
| Dataset | Gene | EntrezID | Gain | Loss | Normal | Detail |
|---|---|---|---|---|---|---|
| GSE15526 | MSTO1 | 55154 | 14 | 0 | 16 | |
| GSE20123 | MSTO1 | 55154 | 13 | 0 | 17 | |
| GSE43470 | MSTO1 | 55154 | 7 | 2 | 34 | |
| GSE46452 | MSTO1 | 55154 | 2 | 1 | 56 | |
| GSE47630 | MSTO1 | 55154 | 14 | 0 | 26 | |
| GSE54993 | MSTO1 | 55154 | 0 | 5 | 65 | |
| GSE54994 | MSTO1 | 55154 | 16 | 0 | 37 | |
| GSE60625 | MSTO1 | 55154 | 0 | 0 | 11 | |
| GSE74703 | MSTO1 | 55154 | 7 | 2 | 27 | |
| GSE74704 | MSTO1 | 55154 | 6 | 0 | 14 | |
| TCGA | MSTO1 | 55154 | 38 | 3 | 55 |
Total number of gains: 117; Total number of losses: 13; Total Number of normals: 358.
Somatic mutations of MSTO1:
Generating mutation plots.
Highly correlated genes for MSTO1:
Showing top 20/1615 corelated genes with mean PCC>0.5.
| Gene1 | Gene2 | Mean PCC | Num. Datasets | Num. PCC<0 | Num. PCC>0.5 |
|---|---|---|---|---|---|
| MSTO1 | DDB1 | 0.82851 | 3 | 0 | 3 |
| MSTO1 | OSR2 | 0.825499 | 3 | 0 | 3 |
| MSTO1 | TRMT61A | 0.823898 | 3 | 0 | 3 |
| MSTO1 | GAS2L1 | 0.822987 | 3 | 0 | 3 |
| MSTO1 | IPO9 | 0.815026 | 4 | 0 | 4 |
| MSTO1 | PIK3R3 | 0.805919 | 3 | 0 | 3 |
| MSTO1 | FYN | 0.790417 | 3 | 0 | 3 |
| MSTO1 | SFR1 | 0.789873 | 3 | 0 | 3 |
| MSTO1 | SEMA3C | 0.788745 | 3 | 0 | 3 |
| MSTO1 | RILPL2 | 0.785225 | 3 | 0 | 3 |
| MSTO1 | MAP3K11 | 0.783536 | 5 | 0 | 5 |
| MSTO1 | ANAPC10 | 0.781312 | 3 | 0 | 3 |
| MSTO1 | SLC25A29 | 0.772986 | 3 | 0 | 3 |
| MSTO1 | SNRPE | 0.77152 | 6 | 0 | 6 |
| MSTO1 | FAM20C | 0.769088 | 3 | 0 | 3 |
| MSTO1 | KRTCAP2 | 0.767852 | 6 | 0 | 6 |
| MSTO1 | FIP1L1 | 0.765147 | 3 | 0 | 3 |
| MSTO1 | SHANK3 | 0.762533 | 3 | 0 | 3 |
| MSTO1 | PET117 | 0.761476 | 4 | 0 | 4 |
| MSTO1 | BLCAP | 0.759763 | 3 | 0 | 3 |
For details and further investigation, click here