| Full name: mitochondrial fission regulator 1 | Alias Symbol: CHPPR|KIAA0009|FAM54A2 | ||
| Type: protein-coding gene | Cytoband: 8q13.1 | ||
| Entrez ID: 9650 | HGNC ID: HGNC:29510 | Ensembl Gene: ENSG00000066855 | OMIM ID: |
Expression of MTFR1:
| Dataset | Gene | EntrezID | Probe | Log2FC | Adj.pValue | Expression |
|---|---|---|---|---|---|---|
| GSE17351 | MTFR1 | 9650 | 203208_s_at | 0.9888 | 0.0642 | |
| GSE20347 | MTFR1 | 9650 | 203208_s_at | 0.6710 | 0.0001 | |
| GSE23400 | MTFR1 | 9650 | 203208_s_at | 0.4994 | 0.0000 | |
| GSE26886 | MTFR1 | 9650 | 203208_s_at | 0.3423 | 0.0741 | |
| GSE29001 | MTFR1 | 9650 | 203208_s_at | 0.5344 | 0.0983 | |
| GSE38129 | MTFR1 | 9650 | 203208_s_at | 0.6920 | 0.0000 | |
| GSE45670 | MTFR1 | 9650 | 203208_s_at | 0.5549 | 0.0011 | |
| GSE53622 | MTFR1 | 9650 | 50862 | 0.5888 | 0.0000 | |
| GSE53624 | MTFR1 | 9650 | 50862 | 0.6130 | 0.0000 | |
| GSE63941 | MTFR1 | 9650 | 203208_s_at | 0.2671 | 0.6247 | |
| GSE77861 | MTFR1 | 9650 | 203208_s_at | 0.2405 | 0.3029 | |
| GSE97050 | MTFR1 | 9650 | A_24_P346587 | 0.3693 | 0.1927 | |
| SRP007169 | MTFR1 | 9650 | RNAseq | -0.0929 | 0.8113 | |
| SRP008496 | MTFR1 | 9650 | RNAseq | 0.1199 | 0.6870 | |
| SRP064894 | MTFR1 | 9650 | RNAseq | 0.5812 | 0.0166 | |
| SRP133303 | MTFR1 | 9650 | RNAseq | 0.8131 | 0.0000 | |
| SRP159526 | MTFR1 | 9650 | RNAseq | 0.3938 | 0.2003 | |
| SRP193095 | MTFR1 | 9650 | RNAseq | 0.2284 | 0.0583 | |
| SRP219564 | MTFR1 | 9650 | RNAseq | 0.5423 | 0.2080 | |
| TCGA | MTFR1 | 9650 | RNAseq | 0.0431 | 0.4864 |
Upregulated datasets: 0; Downregulated datasets: 0.
Survival by MTFR1 expression:
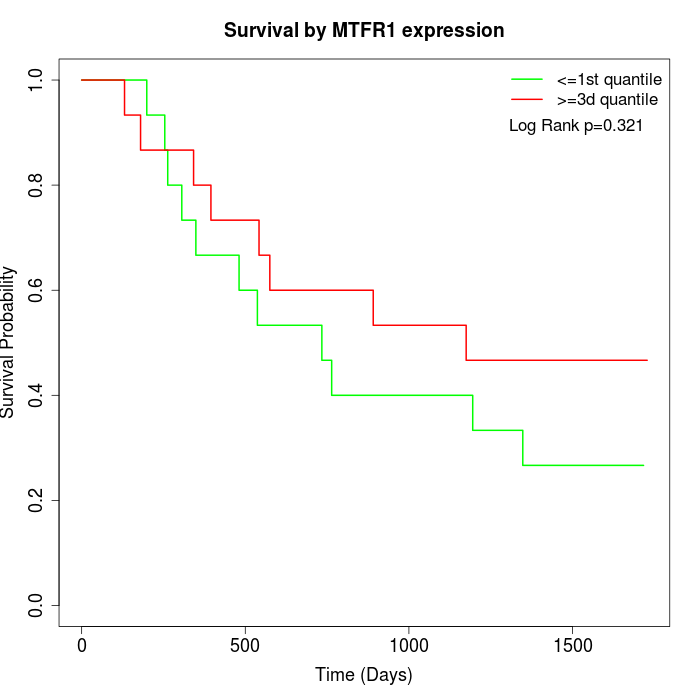 | 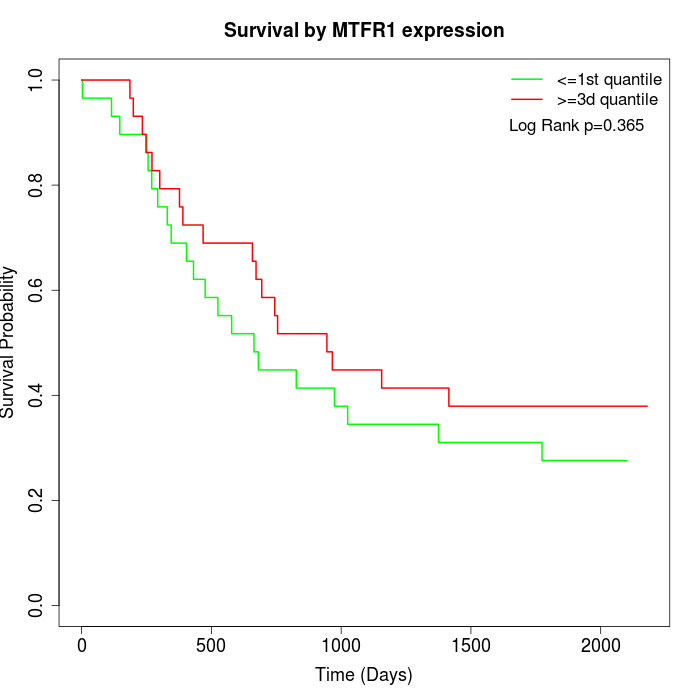 | 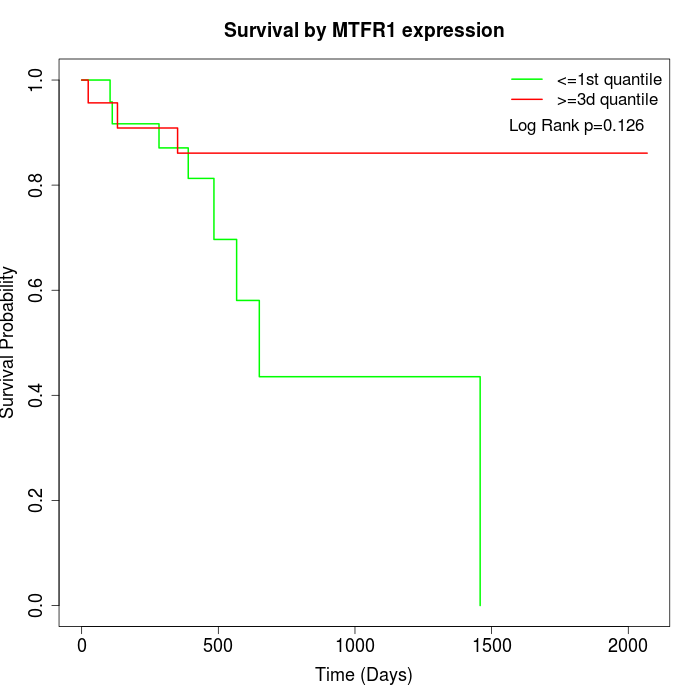 |
| GSE53622 | GSE53624 | TCGA |
Note: Click image to view full size file.
Copy number change of MTFR1:
| Dataset | Gene | EntrezID | Gain | Loss | Normal | Detail |
|---|---|---|---|---|---|---|
| GSE15526 | MTFR1 | 9650 | 13 | 1 | 16 | |
| GSE20123 | MTFR1 | 9650 | 13 | 1 | 16 | |
| GSE43470 | MTFR1 | 9650 | 15 | 3 | 25 | |
| GSE46452 | MTFR1 | 9650 | 21 | 1 | 37 | |
| GSE47630 | MTFR1 | 9650 | 23 | 1 | 16 | |
| GSE54993 | MTFR1 | 9650 | 1 | 18 | 51 | |
| GSE54994 | MTFR1 | 9650 | 30 | 0 | 23 | |
| GSE60625 | MTFR1 | 9650 | 0 | 4 | 7 | |
| GSE74703 | MTFR1 | 9650 | 13 | 2 | 21 | |
| GSE74704 | MTFR1 | 9650 | 9 | 0 | 11 | |
| TCGA | MTFR1 | 9650 | 48 | 5 | 43 |
Total number of gains: 186; Total number of losses: 36; Total Number of normals: 266.
Somatic mutations of MTFR1:
Generating mutation plots.
Highly correlated genes for MTFR1:
Showing top 20/1369 corelated genes with mean PCC>0.5.
| Gene1 | Gene2 | Mean PCC | Num. Datasets | Num. PCC<0 | Num. PCC>0.5 |
|---|---|---|---|---|---|
| MTFR1 | TP53RK | 0.825911 | 3 | 0 | 3 |
| MTFR1 | TYW5 | 0.747609 | 3 | 0 | 3 |
| MTFR1 | ARHGAP39 | 0.72887 | 3 | 0 | 3 |
| MTFR1 | LRRC58 | 0.726373 | 4 | 0 | 4 |
| MTFR1 | COPS5 | 0.725601 | 12 | 0 | 12 |
| MTFR1 | SLC7A6OS | 0.723583 | 5 | 0 | 5 |
| MTFR1 | ALG1 | 0.718458 | 3 | 0 | 3 |
| MTFR1 | POLR2K | 0.71456 | 9 | 0 | 8 |
| MTFR1 | PDRG1 | 0.714397 | 4 | 0 | 4 |
| MTFR1 | B3GALT6 | 0.703004 | 4 | 0 | 3 |
| MTFR1 | MTERF3 | 0.700233 | 9 | 0 | 8 |
| MTFR1 | SIX4 | 0.696015 | 5 | 0 | 4 |
| MTFR1 | GZF1 | 0.691719 | 3 | 0 | 3 |
| MTFR1 | ARMC1 | 0.690837 | 13 | 0 | 10 |
| MTFR1 | UBTD2 | 0.68947 | 4 | 0 | 4 |
| MTFR1 | DPY19L4 | 0.689364 | 12 | 0 | 11 |
| MTFR1 | TMEM70 | 0.687482 | 8 | 0 | 8 |
| MTFR1 | MAP4K4 | 0.686224 | 3 | 0 | 3 |
| MTFR1 | CENPBD1 | 0.685611 | 4 | 0 | 3 |
| MTFR1 | PPP1R9B | 0.683323 | 3 | 0 | 3 |
For details and further investigation, click here