| Full name: NADPH dependent diflavin oxidoreductase 1 | Alias Symbol: NR1|bA350O14.9|CIAE1 | ||
| Type: protein-coding gene | Cytoband: 9q34.3 | ||
| Entrez ID: 27158 | HGNC ID: HGNC:29838 | Ensembl Gene: ENSG00000188566 | OMIM ID: 606073 |
Screen Evidence:
| |||
Expression of NDOR1:
| Dataset | Gene | EntrezID | Probe | Log2FC | Adj.pValue | Expression |
|---|---|---|---|---|---|---|
| GSE17351 | NDOR1 | 27158 | 227739_at | -0.6097 | 0.1664 | |
| GSE20347 | NDOR1 | 27158 | 219899_x_at | -0.0057 | 0.9600 | |
| GSE23400 | NDOR1 | 27158 | 219899_x_at | -0.0319 | 0.4629 | |
| GSE26886 | NDOR1 | 27158 | 227739_at | -0.5224 | 0.0007 | |
| GSE29001 | NDOR1 | 27158 | 219899_x_at | -0.1975 | 0.2444 | |
| GSE38129 | NDOR1 | 27158 | 219899_x_at | -0.1260 | 0.1188 | |
| GSE45670 | NDOR1 | 27158 | 227739_at | -0.2035 | 0.3455 | |
| GSE53622 | NDOR1 | 27158 | 52157 | 0.5829 | 0.0000 | |
| GSE53624 | NDOR1 | 27158 | 52157 | 0.6917 | 0.0000 | |
| GSE63941 | NDOR1 | 27158 | 227739_at | 0.5381 | 0.0024 | |
| GSE77861 | NDOR1 | 27158 | 227739_at | -0.4230 | 0.0098 | |
| GSE97050 | NDOR1 | 27158 | A_33_P3404508 | 0.7030 | 0.1057 | |
| SRP007169 | NDOR1 | 27158 | RNAseq | -3.7988 | 0.0000 | |
| SRP008496 | NDOR1 | 27158 | RNAseq | -3.6987 | 0.0000 | |
| SRP064894 | NDOR1 | 27158 | RNAseq | -0.7668 | 0.0069 | |
| SRP133303 | NDOR1 | 27158 | RNAseq | -0.9103 | 0.0000 | |
| SRP159526 | NDOR1 | 27158 | RNAseq | -0.9763 | 0.0030 | |
| SRP193095 | NDOR1 | 27158 | RNAseq | -1.2733 | 0.0000 | |
| SRP219564 | NDOR1 | 27158 | RNAseq | -0.8304 | 0.1225 | |
| TCGA | NDOR1 | 27158 | RNAseq | -0.1184 | 0.0538 |
Upregulated datasets: 0; Downregulated datasets: 3.
Survival by NDOR1 expression:
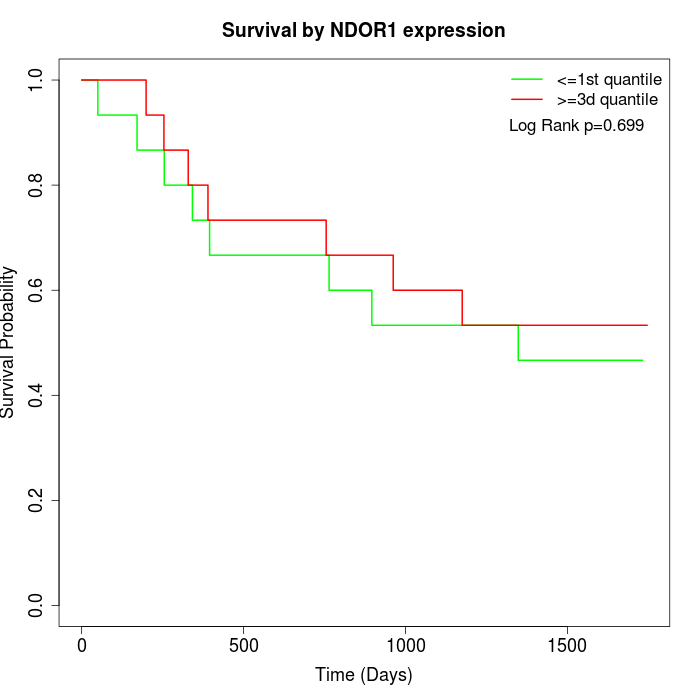 | 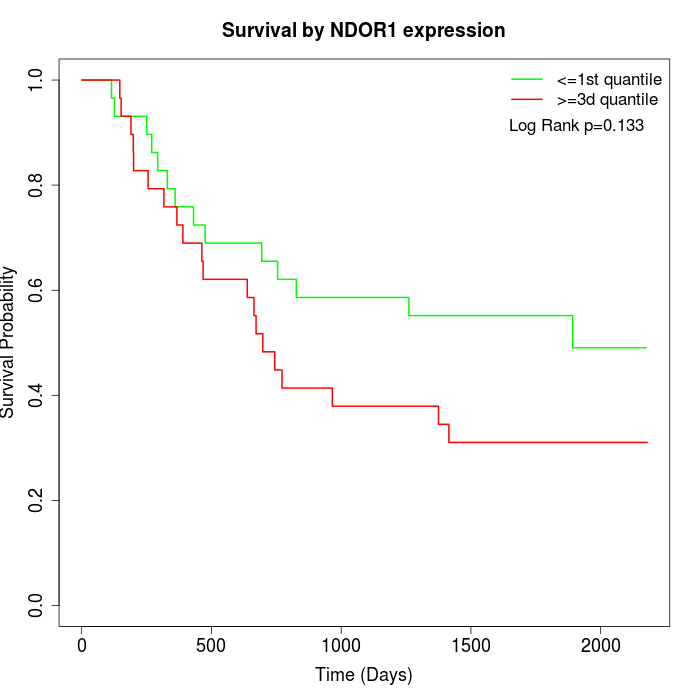 | 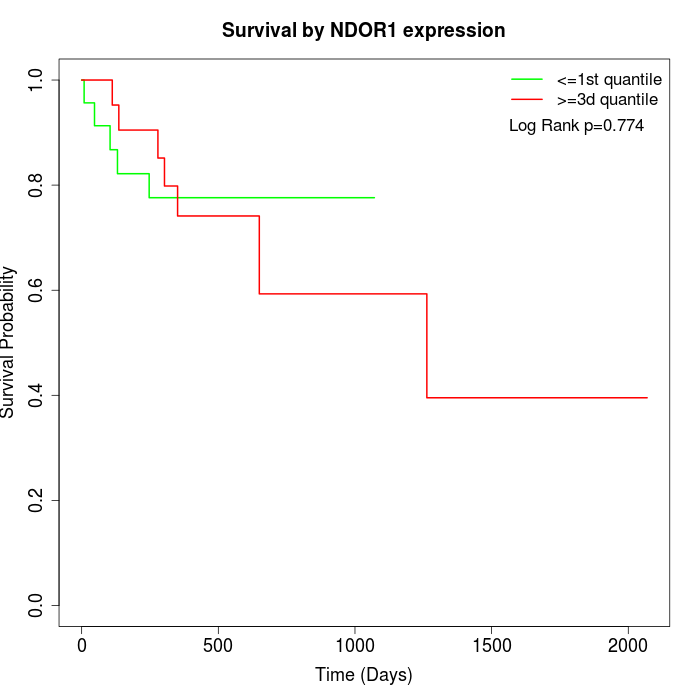 |
| GSE53622 | GSE53624 | TCGA |
Note: Click image to view full size file.
Copy number change of NDOR1:
| Dataset | Gene | EntrezID | Gain | Loss | Normal | Detail |
|---|---|---|---|---|---|---|
| GSE15526 | NDOR1 | 27158 | 5 | 7 | 18 | |
| GSE20123 | NDOR1 | 27158 | 5 | 7 | 18 | |
| GSE43470 | NDOR1 | 27158 | 3 | 7 | 33 | |
| GSE46452 | NDOR1 | 27158 | 6 | 13 | 40 | |
| GSE47630 | NDOR1 | 27158 | 6 | 15 | 19 | |
| GSE54993 | NDOR1 | 27158 | 3 | 3 | 64 | |
| GSE54994 | NDOR1 | 27158 | 12 | 8 | 33 | |
| GSE60625 | NDOR1 | 27158 | 0 | 0 | 11 | |
| GSE74703 | NDOR1 | 27158 | 3 | 5 | 28 | |
| GSE74704 | NDOR1 | 27158 | 3 | 5 | 12 | |
| TCGA | NDOR1 | 27158 | 29 | 23 | 44 |
Total number of gains: 75; Total number of losses: 93; Total Number of normals: 320.
Somatic mutations of NDOR1:
Generating mutation plots.
Highly correlated genes for NDOR1:
Showing top 20/824 corelated genes with mean PCC>0.5.
| Gene1 | Gene2 | Mean PCC | Num. Datasets | Num. PCC<0 | Num. PCC>0.5 |
|---|---|---|---|---|---|
| NDOR1 | HLA-DOB | 0.781846 | 3 | 0 | 3 |
| NDOR1 | SFTA2 | 0.77138 | 5 | 0 | 5 |
| NDOR1 | GBP6 | 0.770159 | 5 | 0 | 5 |
| NDOR1 | ATP6V1C2 | 0.765773 | 5 | 0 | 5 |
| NDOR1 | ZNRF1 | 0.759353 | 4 | 0 | 4 |
| NDOR1 | SNX24 | 0.735627 | 4 | 0 | 4 |
| NDOR1 | SNORA68 | 0.730012 | 4 | 0 | 4 |
| NDOR1 | PPP4C | 0.716428 | 3 | 0 | 3 |
| NDOR1 | SPNS2 | 0.716277 | 5 | 0 | 4 |
| NDOR1 | TXN | 0.714272 | 4 | 0 | 4 |
| NDOR1 | IL22RA1 | 0.710282 | 5 | 0 | 5 |
| NDOR1 | IQGAP3 | 0.708371 | 5 | 0 | 4 |
| NDOR1 | EVPLL | 0.704201 | 5 | 0 | 4 |
| NDOR1 | EML3 | 0.703244 | 7 | 0 | 6 |
| NDOR1 | TPRN | 0.701524 | 5 | 0 | 4 |
| NDOR1 | LMNTD2 | 0.701381 | 3 | 0 | 3 |
| NDOR1 | MIR210HG | 0.700027 | 4 | 0 | 4 |
| NDOR1 | TEKT5 | 0.699703 | 4 | 0 | 4 |
| NDOR1 | SNX11 | 0.699172 | 4 | 0 | 4 |
| NDOR1 | CLTB | 0.6978 | 5 | 0 | 5 |
For details and further investigation, click here