| Full name: sphingolipid transporter 2 | Alias Symbol: SLC62A2 | ||
| Type: protein-coding gene | Cytoband: 17p13.2 | ||
| Entrez ID: 124976 | HGNC ID: HGNC:26992 | Ensembl Gene: ENSG00000183018 | OMIM ID: 612584 |
Screen Evidence:
| |||
Expression of SPNS2:
| Dataset | Gene | EntrezID | Probe | Log2FC | Adj.pValue | Expression |
|---|---|---|---|---|---|---|
| GSE17351 | SPNS2 | 124976 | 225671_at | -1.7076 | 0.1097 | |
| GSE26886 | SPNS2 | 124976 | 225671_at | -3.7003 | 0.0000 | |
| GSE45670 | SPNS2 | 124976 | 225671_at | -0.8463 | 0.0468 | |
| GSE63941 | SPNS2 | 124976 | 225671_at | 0.4533 | 0.3315 | |
| GSE77861 | SPNS2 | 124976 | 225671_at | -2.1628 | 0.0008 | |
| GSE97050 | SPNS2 | 124976 | A_24_P8371 | -0.8690 | 0.2236 | |
| SRP007169 | SPNS2 | 124976 | RNAseq | -5.2217 | 0.0000 | |
| SRP008496 | SPNS2 | 124976 | RNAseq | -4.7508 | 0.0000 | |
| SRP064894 | SPNS2 | 124976 | RNAseq | -3.8112 | 0.0000 | |
| SRP133303 | SPNS2 | 124976 | RNAseq | -4.0585 | 0.0000 | |
| SRP159526 | SPNS2 | 124976 | RNAseq | -3.9224 | 0.0000 | |
| SRP193095 | SPNS2 | 124976 | RNAseq | -3.6005 | 0.0000 | |
| SRP219564 | SPNS2 | 124976 | RNAseq | -3.5775 | 0.0000 | |
| TCGA | SPNS2 | 124976 | RNAseq | -0.5484 | 0.0005 |
Upregulated datasets: 0; Downregulated datasets: 9.
Survival by SPNS2 expression:
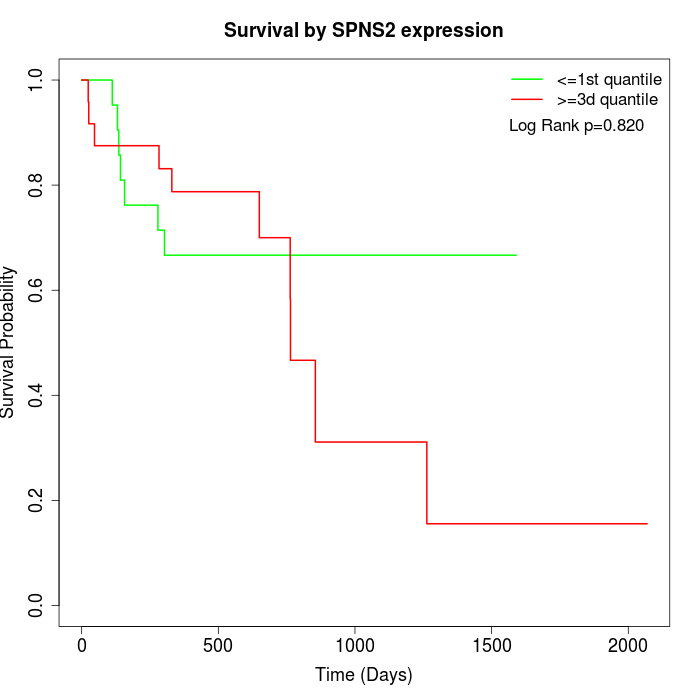 |
| TCGA |
Note: Click image to view full size file.
Copy number change of SPNS2:
| Dataset | Gene | EntrezID | Gain | Loss | Normal | Detail |
|---|---|---|---|---|---|---|
| GSE15526 | SPNS2 | 124976 | 5 | 2 | 23 | |
| GSE20123 | SPNS2 | 124976 | 5 | 3 | 22 | |
| GSE43470 | SPNS2 | 124976 | 1 | 6 | 36 | |
| GSE46452 | SPNS2 | 124976 | 34 | 1 | 24 | |
| GSE47630 | SPNS2 | 124976 | 7 | 1 | 32 | |
| GSE54993 | SPNS2 | 124976 | 4 | 3 | 63 | |
| GSE54994 | SPNS2 | 124976 | 5 | 9 | 39 | |
| GSE60625 | SPNS2 | 124976 | 4 | 0 | 7 | |
| GSE74703 | SPNS2 | 124976 | 1 | 3 | 32 | |
| GSE74704 | SPNS2 | 124976 | 3 | 1 | 16 | |
| TCGA | SPNS2 | 124976 | 18 | 21 | 57 |
Total number of gains: 87; Total number of losses: 50; Total Number of normals: 351.
Somatic mutations of SPNS2:
Generating mutation plots.
Highly correlated genes for SPNS2:
Showing top 20/1211 corelated genes with mean PCC>0.5.
| Gene1 | Gene2 | Mean PCC | Num. Datasets | Num. PCC<0 | Num. PCC>0.5 |
|---|---|---|---|---|---|
| SPNS2 | RANBP9 | 0.927 | 5 | 0 | 5 |
| SPNS2 | GYS2 | 0.892182 | 4 | 0 | 4 |
| SPNS2 | PHACTR4 | 0.883762 | 5 | 0 | 5 |
| SPNS2 | FAM214A | 0.883079 | 4 | 0 | 4 |
| SPNS2 | GBP6 | 0.881104 | 4 | 0 | 4 |
| SPNS2 | ABLIM3 | 0.875355 | 4 | 0 | 4 |
| SPNS2 | SLC16A6 | 0.871643 | 5 | 0 | 5 |
| SPNS2 | FCHO2 | 0.870938 | 5 | 0 | 5 |
| SPNS2 | KRT78 | 0.86971 | 6 | 0 | 6 |
| SPNS2 | KLB | 0.86871 | 4 | 0 | 4 |
| SPNS2 | ESPL1 | 0.86868 | 4 | 0 | 4 |
| SPNS2 | CITED2 | 0.866141 | 3 | 0 | 3 |
| SPNS2 | CRISP3 | 0.863505 | 5 | 0 | 5 |
| SPNS2 | ATP6V1C2 | 0.86082 | 4 | 0 | 4 |
| SPNS2 | ANXA9 | 0.859139 | 6 | 0 | 6 |
| SPNS2 | SMIM5 | 0.854768 | 5 | 0 | 5 |
| SPNS2 | CCNG2 | 0.853364 | 5 | 0 | 5 |
| SPNS2 | CAPN5 | 0.85175 | 5 | 0 | 5 |
| SPNS2 | EPS8L2 | 0.849004 | 4 | 0 | 4 |
| SPNS2 | EPS8L1 | 0.84798 | 7 | 0 | 7 |
For details and further investigation, click here