| Full name: nitric oxide associated 1 | Alias Symbol: MGC3232|hAtNOS1|hNOA1|MTG3 | ||
| Type: protein-coding gene | Cytoband: 4q12 | ||
| Entrez ID: 84273 | HGNC ID: HGNC:28473 | Ensembl Gene: ENSG00000084092 | OMIM ID: 614919 |
Screen Evidence:
| |||
Expression of NOA1:
| Dataset | Gene | EntrezID | Probe | Log2FC | Adj.pValue | Expression |
|---|---|---|---|---|---|---|
| GSE17351 | NOA1 | 84273 | 223157_at | -0.0413 | 0.9204 | |
| GSE26886 | NOA1 | 84273 | 223157_at | 0.1992 | 0.3485 | |
| GSE45670 | NOA1 | 84273 | 223157_at | -0.3164 | 0.2742 | |
| GSE53622 | NOA1 | 84273 | 53176 | -0.0336 | 0.6604 | |
| GSE53624 | NOA1 | 84273 | 53176 | -0.0900 | 0.1669 | |
| GSE63941 | NOA1 | 84273 | 223157_at | 0.2624 | 0.5987 | |
| GSE77861 | NOA1 | 84273 | 223157_at | -0.3221 | 0.1640 | |
| GSE97050 | NOA1 | 84273 | A_23_P7074 | 0.0536 | 0.8247 | |
| SRP007169 | NOA1 | 84273 | RNAseq | -1.0795 | 0.0230 | |
| SRP008496 | NOA1 | 84273 | RNAseq | -0.9352 | 0.0007 | |
| SRP064894 | NOA1 | 84273 | RNAseq | -0.2480 | 0.1924 | |
| SRP133303 | NOA1 | 84273 | RNAseq | -0.1803 | 0.2864 | |
| SRP159526 | NOA1 | 84273 | RNAseq | -0.4578 | 0.0373 | |
| SRP193095 | NOA1 | 84273 | RNAseq | -0.5635 | 0.0000 | |
| SRP219564 | NOA1 | 84273 | RNAseq | -0.6817 | 0.0001 |
Upregulated datasets: 0; Downregulated datasets: 1.
Survival by NOA1 expression:
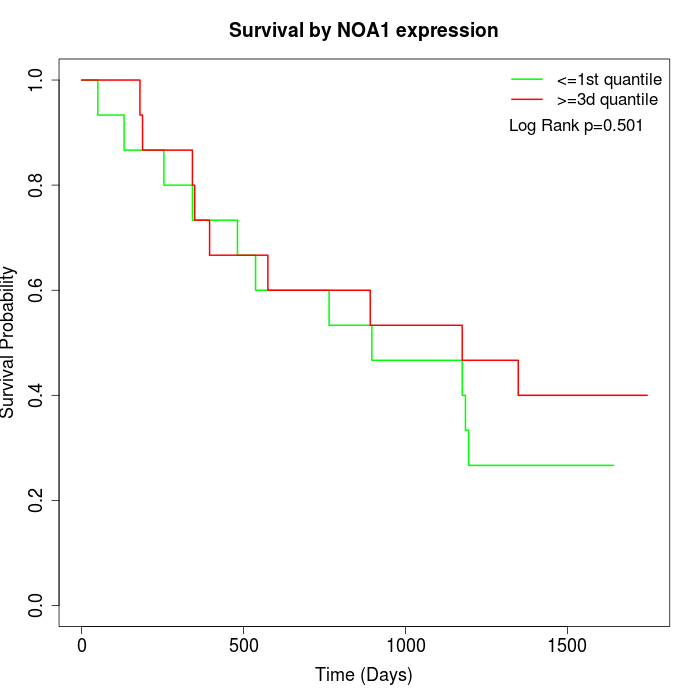 | 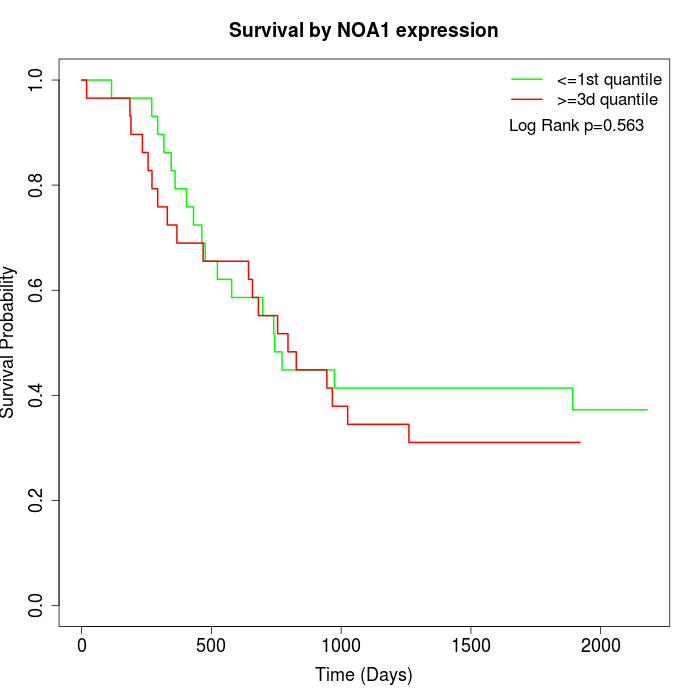 |
| GSE53622 | GSE53624 |
Note: Click image to view full size file.
Copy number change of NOA1:
| Dataset | Gene | EntrezID | Gain | Loss | Normal | Detail |
|---|---|---|---|---|---|---|
| GSE15526 | NOA1 | 84273 | 3 | 12 | 15 | |
| GSE20123 | NOA1 | 84273 | 2 | 12 | 16 | |
| GSE43470 | NOA1 | 84273 | 0 | 14 | 29 | |
| GSE46452 | NOA1 | 84273 | 1 | 36 | 22 | |
| GSE47630 | NOA1 | 84273 | 0 | 19 | 21 | |
| GSE54993 | NOA1 | 84273 | 7 | 0 | 63 | |
| GSE54994 | NOA1 | 84273 | 2 | 10 | 41 | |
| GSE60625 | NOA1 | 84273 | 0 | 0 | 11 | |
| GSE74703 | NOA1 | 84273 | 0 | 12 | 24 | |
| GSE74704 | NOA1 | 84273 | 1 | 7 | 12 | |
| TCGA | NOA1 | 84273 | 20 | 26 | 50 |
Total number of gains: 36; Total number of losses: 148; Total Number of normals: 304.
Somatic mutations of NOA1:
Generating mutation plots.
Highly correlated genes for NOA1:
Showing top 20/275 corelated genes with mean PCC>0.5.
| Gene1 | Gene2 | Mean PCC | Num. Datasets | Num. PCC<0 | Num. PCC>0.5 |
|---|---|---|---|---|---|
| NOA1 | REST | 0.798174 | 3 | 0 | 3 |
| NOA1 | NUP133 | 0.783729 | 3 | 0 | 3 |
| NOA1 | NOTCH2 | 0.779658 | 3 | 0 | 3 |
| NOA1 | POLH | 0.778092 | 3 | 0 | 3 |
| NOA1 | GIMAP6 | 0.773955 | 3 | 0 | 3 |
| NOA1 | DCAF10 | 0.771289 | 3 | 0 | 3 |
| NOA1 | VPS26A | 0.769514 | 3 | 0 | 3 |
| NOA1 | BTN2A2 | 0.761848 | 3 | 0 | 3 |
| NOA1 | FLI1 | 0.755087 | 3 | 0 | 3 |
| NOA1 | NCKAP1L | 0.753029 | 3 | 0 | 3 |
| NOA1 | EXOC1 | 0.750252 | 4 | 0 | 4 |
| NOA1 | MS4A6A | 0.749514 | 3 | 0 | 3 |
| NOA1 | USP9Y | 0.748589 | 3 | 0 | 3 |
| NOA1 | EIF1AY | 0.744105 | 3 | 0 | 3 |
| NOA1 | MRPL13 | 0.740221 | 3 | 0 | 3 |
| NOA1 | CST7 | 0.738958 | 3 | 0 | 3 |
| NOA1 | GPR65 | 0.732067 | 3 | 0 | 3 |
| NOA1 | TYW3 | 0.728961 | 3 | 0 | 3 |
| NOA1 | BTG1 | 0.723799 | 3 | 0 | 3 |
| NOA1 | CHIC2 | 0.723609 | 4 | 0 | 3 |
For details and further investigation, click here