| Full name: natriuretic peptide A | Alias Symbol: | ||
| Type: protein-coding gene | Cytoband: 1p36.22 | ||
| Entrez ID: 4878 | HGNC ID: HGNC:7939 | Ensembl Gene: ENSG00000175206 | OMIM ID: 108780 |
NPPA involved pathways:
| KEGG pathway | Description | View |
|---|---|---|
| hsa04066 | HIF-1 signaling pathway |
Expression of NPPA:
| Dataset | Gene | EntrezID | Probe | Log2FC | Adj.pValue | Expression |
|---|---|---|---|---|---|---|
| GSE17351 | NPPA | 4878 | 209957_s_at | 0.0066 | 0.9849 | |
| GSE20347 | NPPA | 4878 | 209957_s_at | -0.1269 | 0.1213 | |
| GSE23400 | NPPA | 4878 | 209957_s_at | -0.1175 | 0.0031 | |
| GSE26886 | NPPA | 4878 | 209957_s_at | 0.1167 | 0.3098 | |
| GSE29001 | NPPA | 4878 | 209957_s_at | -0.1767 | 0.3752 | |
| GSE38129 | NPPA | 4878 | 209957_s_at | -0.2393 | 0.0219 | |
| GSE45670 | NPPA | 4878 | 209957_s_at | 0.0021 | 0.9854 | |
| GSE53622 | NPPA | 4878 | 105691 | -0.1974 | 0.0771 | |
| GSE53624 | NPPA | 4878 | 105691 | -0.1006 | 0.2802 | |
| GSE63941 | NPPA | 4878 | 209957_s_at | 0.2576 | 0.0226 | |
| GSE77861 | NPPA | 4878 | 209957_s_at | -0.0377 | 0.8347 | |
| GSE97050 | NPPA | 4878 | A_33_P3323699 | -0.0919 | 0.6256 | |
| SRP219564 | NPPA | 4878 | RNAseq | 0.0156 | 0.9807 | |
| TCGA | NPPA | 4878 | RNAseq | -0.1903 | 0.6857 |
Upregulated datasets: 0; Downregulated datasets: 0.
Survival by NPPA expression:
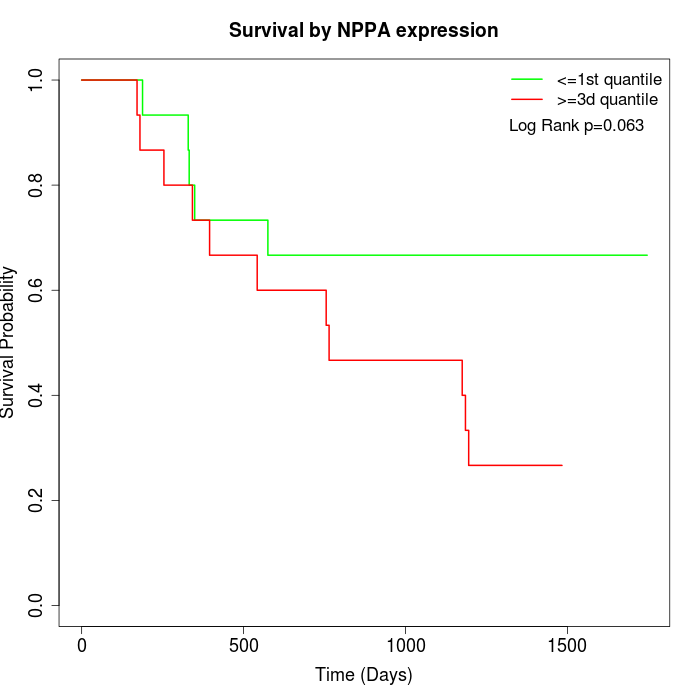 | 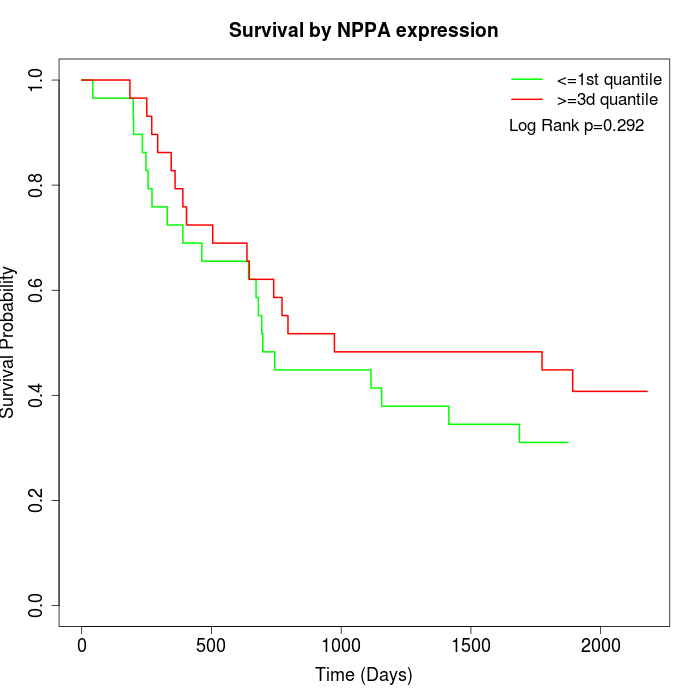 | 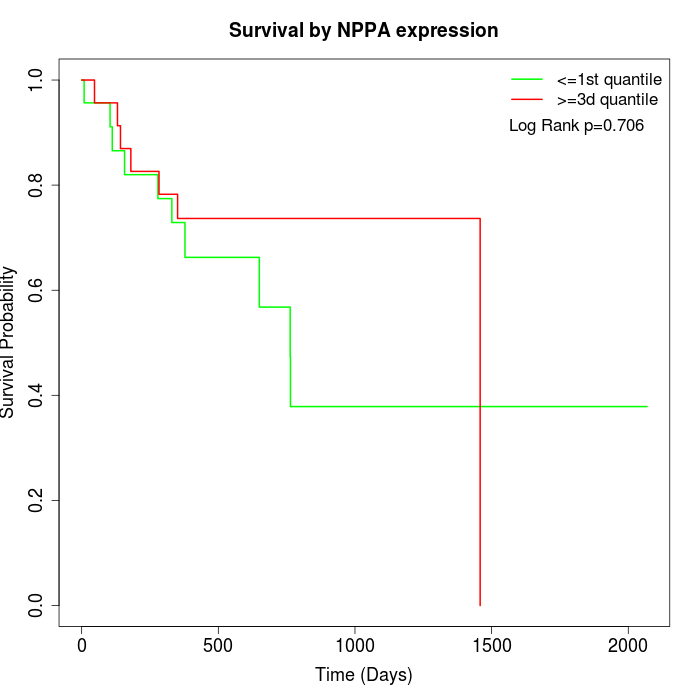 |
| GSE53622 | GSE53624 | TCGA |
Note: Click image to view full size file.
Copy number change of NPPA:
| Dataset | Gene | EntrezID | Gain | Loss | Normal | Detail |
|---|---|---|---|---|---|---|
| GSE15526 | NPPA | 4878 | 0 | 5 | 25 | |
| GSE20123 | NPPA | 4878 | 0 | 4 | 26 | |
| GSE43470 | NPPA | 4878 | 4 | 6 | 33 | |
| GSE46452 | NPPA | 4878 | 7 | 1 | 51 | |
| GSE47630 | NPPA | 4878 | 8 | 4 | 28 | |
| GSE54993 | NPPA | 4878 | 3 | 1 | 66 | |
| GSE54994 | NPPA | 4878 | 11 | 4 | 38 | |
| GSE60625 | NPPA | 4878 | 0 | 0 | 11 | |
| GSE74703 | NPPA | 4878 | 3 | 4 | 29 | |
| GSE74704 | NPPA | 4878 | 0 | 0 | 20 | |
| TCGA | NPPA | 4878 | 10 | 22 | 64 |
Total number of gains: 46; Total number of losses: 51; Total Number of normals: 391.
Somatic mutations of NPPA:
Generating mutation plots.
Highly correlated genes for NPPA:
Showing top 20/1114 corelated genes with mean PCC>0.5.
| Gene1 | Gene2 | Mean PCC | Num. Datasets | Num. PCC<0 | Num. PCC>0.5 |
|---|---|---|---|---|---|
| NPPA | CLCNKA | 0.847382 | 3 | 0 | 3 |
| NPPA | TMEM229A | 0.788823 | 3 | 0 | 3 |
| NPPA | KATNAL2 | 0.783328 | 3 | 0 | 3 |
| NPPA | FBRSL1 | 0.763779 | 3 | 0 | 3 |
| NPPA | SPACA3 | 0.76284 | 3 | 0 | 3 |
| NPPA | EYS | 0.753483 | 3 | 0 | 3 |
| NPPA | PRR18 | 0.75021 | 3 | 0 | 3 |
| NPPA | ZNF221 | 0.747412 | 4 | 0 | 4 |
| NPPA | ENAM | 0.735579 | 3 | 0 | 3 |
| NPPA | GPR150 | 0.734069 | 3 | 0 | 3 |
| NPPA | TTBK1 | 0.733919 | 3 | 0 | 3 |
| NPPA | GDF7 | 0.730536 | 3 | 0 | 3 |
| NPPA | SYCE3 | 0.71988 | 3 | 0 | 3 |
| NPPA | KRTAP3-1 | 0.717807 | 4 | 0 | 4 |
| NPPA | MAGEA8 | 0.717763 | 3 | 0 | 3 |
| NPPA | FOXA3 | 0.715287 | 4 | 0 | 3 |
| NPPA | CDX2 | 0.712847 | 6 | 0 | 5 |
| NPPA | SUN5 | 0.70772 | 4 | 0 | 3 |
| NPPA | ZSWIM3 | 0.700969 | 3 | 0 | 3 |
| NPPA | CALCOCO1 | 0.698778 | 3 | 0 | 3 |
For details and further investigation, click here