| Full name: annexin A10 | Alias Symbol: ANX14 | ||
| Type: protein-coding gene | Cytoband: 4q32.3 | ||
| Entrez ID: 11199 | HGNC ID: HGNC:534 | Ensembl Gene: ENSG00000109511 | OMIM ID: 608008 |
Expression of ANXA10:
| Dataset | Gene | EntrezID | Probe | Log2FC | Adj.pValue | Expression |
|---|---|---|---|---|---|---|
| GSE17351 | ANXA10 | 11199 | 210143_at | 0.3711 | 0.4284 | |
| GSE20347 | ANXA10 | 11199 | 210143_at | 0.8522 | 0.0521 | |
| GSE23400 | ANXA10 | 11199 | 210143_at | 0.1720 | 0.3484 | |
| GSE26886 | ANXA10 | 11199 | 210143_at | 0.7358 | 0.0297 | |
| GSE29001 | ANXA10 | 11199 | 210143_at | 0.4427 | 0.3948 | |
| GSE38129 | ANXA10 | 11199 | 210143_at | 0.1737 | 0.7452 | |
| GSE45670 | ANXA10 | 11199 | 210143_at | 0.7092 | 0.0657 | |
| GSE53622 | ANXA10 | 11199 | 138431 | 0.2620 | 0.3720 | |
| GSE53624 | ANXA10 | 11199 | 138431 | 0.1072 | 0.6669 | |
| GSE63941 | ANXA10 | 11199 | 210143_at | 0.0480 | 0.9819 | |
| GSE77861 | ANXA10 | 11199 | 210143_at | 0.5598 | 0.2469 | |
| GSE97050 | ANXA10 | 11199 | A_23_P58328 | 0.1542 | 0.4667 | |
| TCGA | ANXA10 | 11199 | RNAseq | -2.1983 | 0.0023 |
Upregulated datasets: 0; Downregulated datasets: 1.
Survival by ANXA10 expression:
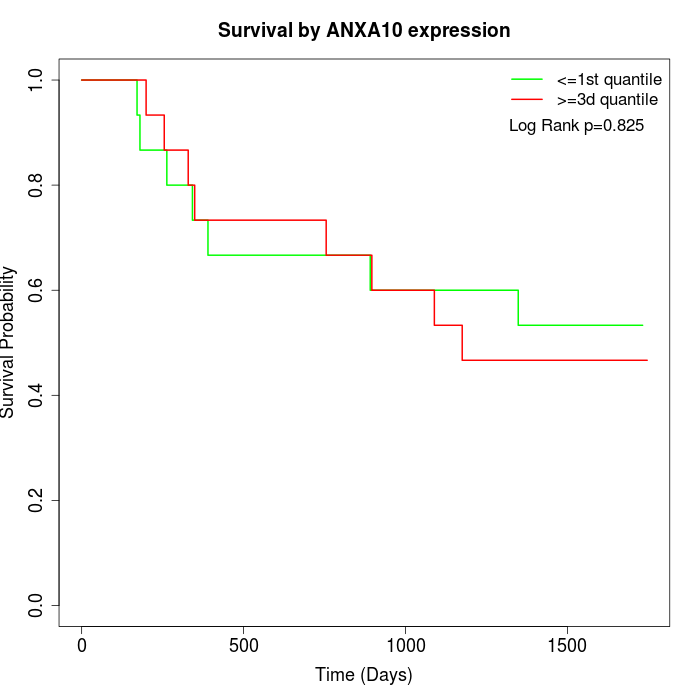 | 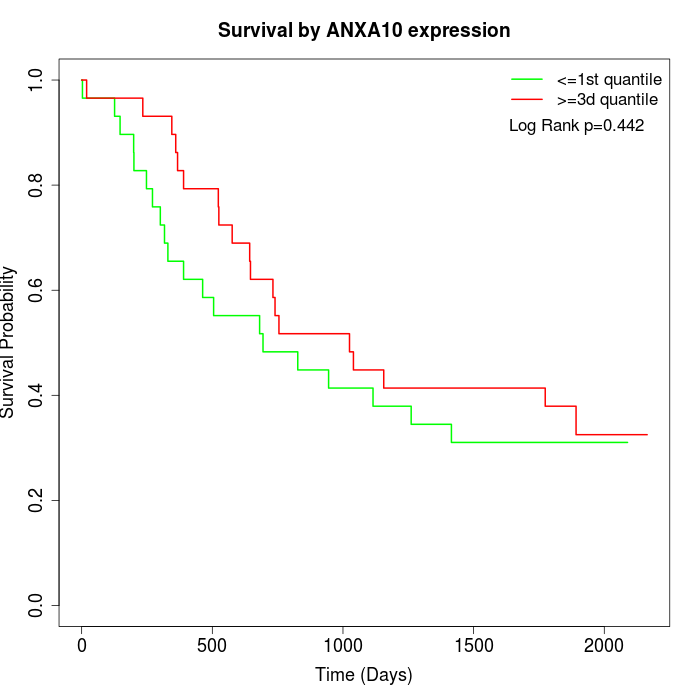 |  |
| GSE53622 | GSE53624 | TCGA |
Note: Click image to view full size file.
Copy number change of ANXA10:
| Dataset | Gene | EntrezID | Gain | Loss | Normal | Detail |
|---|---|---|---|---|---|---|
| GSE15526 | ANXA10 | 11199 | 1 | 11 | 18 | |
| GSE20123 | ANXA10 | 11199 | 1 | 11 | 18 | |
| GSE43470 | ANXA10 | 11199 | 0 | 13 | 30 | |
| GSE46452 | ANXA10 | 11199 | 1 | 36 | 22 | |
| GSE47630 | ANXA10 | 11199 | 0 | 22 | 18 | |
| GSE54993 | ANXA10 | 11199 | 10 | 0 | 60 | |
| GSE54994 | ANXA10 | 11199 | 1 | 13 | 39 | |
| GSE60625 | ANXA10 | 11199 | 0 | 0 | 11 | |
| GSE74703 | ANXA10 | 11199 | 0 | 11 | 25 | |
| GSE74704 | ANXA10 | 11199 | 0 | 5 | 15 | |
| TCGA | ANXA10 | 11199 | 12 | 32 | 52 |
Total number of gains: 26; Total number of losses: 154; Total Number of normals: 308.
Somatic mutations of ANXA10:
Generating mutation plots.
Highly correlated genes for ANXA10:
Showing top 20/136 corelated genes with mean PCC>0.5.
| Gene1 | Gene2 | Mean PCC | Num. Datasets | Num. PCC<0 | Num. PCC>0.5 |
|---|---|---|---|---|---|
| ANXA10 | CA6 | 0.805763 | 3 | 0 | 3 |
| ANXA10 | NR2E1 | 0.804194 | 3 | 0 | 3 |
| ANXA10 | NID2 | 0.781685 | 3 | 0 | 3 |
| ANXA10 | TCTE3 | 0.778062 | 3 | 0 | 3 |
| ANXA10 | POM121L12 | 0.744911 | 3 | 0 | 3 |
| ANXA10 | NXPE3 | 0.738284 | 3 | 0 | 3 |
| ANXA10 | PCSK1N | 0.738254 | 3 | 0 | 3 |
| ANXA10 | PMEPA1 | 0.729762 | 3 | 0 | 3 |
| ANXA10 | TREM1 | 0.728989 | 4 | 0 | 4 |
| ANXA10 | NLRP5 | 0.72572 | 3 | 0 | 3 |
| ANXA10 | POLD1 | 0.716036 | 3 | 0 | 3 |
| ANXA10 | GGTLC1 | 0.714182 | 3 | 0 | 3 |
| ANXA10 | GOLGA7B | 0.713777 | 3 | 0 | 3 |
| ANXA10 | FCN2 | 0.698316 | 3 | 0 | 3 |
| ANXA10 | GPRIN1 | 0.683847 | 4 | 0 | 4 |
| ANXA10 | PRAME | 0.679569 | 4 | 0 | 4 |
| ANXA10 | PHGR1 | 0.678731 | 4 | 0 | 3 |
| ANXA10 | LIF | 0.67459 | 4 | 0 | 3 |
| ANXA10 | TCTE1 | 0.668156 | 3 | 0 | 3 |
| ANXA10 | KRTAP4-1 | 0.666944 | 4 | 0 | 3 |
For details and further investigation, click here