| Full name: programmed cell death 1 | Alias Symbol: CD279|PD1|hSLE1|PD-1 | ||
| Type: protein-coding gene | Cytoband: 2q37.3 | ||
| Entrez ID: 5133 | HGNC ID: HGNC:8760 | Ensembl Gene: ENSG00000188389 | OMIM ID: 600244 |
| Related drugs: NIVOLUMAB, PEMBROLIZUMAB, PIDILIZUMAB, PROCARBAZINE... [more] | |||
PDCD1 involved pathways:
| KEGG pathway | Description | View |
|---|---|---|
| hsa04660 | T cell receptor signaling pathway |
Expression of PDCD1:
| Dataset | Gene | EntrezID | Probe | Log2FC | Adj.pValue | Expression |
|---|---|---|---|---|---|---|
| GSE17351 | PDCD1 | 5133 | 207634_at | 0.0288 | 0.9352 | |
| GSE20347 | PDCD1 | 5133 | 207634_at | 0.0571 | 0.6368 | |
| GSE23400 | PDCD1 | 5133 | 207634_at | -0.1038 | 0.0010 | |
| GSE26886 | PDCD1 | 5133 | 207634_at | 0.2144 | 0.0492 | |
| GSE29001 | PDCD1 | 5133 | 207634_at | -0.0090 | 0.9663 | |
| GSE38129 | PDCD1 | 5133 | 207634_at | -0.0150 | 0.8694 | |
| GSE45670 | PDCD1 | 5133 | 207634_at | 0.0967 | 0.2678 | |
| GSE53622 | PDCD1 | 5133 | 27878 | 0.3234 | 0.0001 | |
| GSE53624 | PDCD1 | 5133 | 27878 | 0.4117 | 0.0000 | |
| GSE63941 | PDCD1 | 5133 | 207634_at | 0.1747 | 0.2406 | |
| GSE77861 | PDCD1 | 5133 | 207634_at | -0.0708 | 0.7247 | |
| SRP133303 | PDCD1 | 5133 | RNAseq | 0.0461 | 0.9037 | |
| SRP219564 | PDCD1 | 5133 | RNAseq | 1.2864 | 0.0704 | |
| TCGA | PDCD1 | 5133 | RNAseq | 0.4338 | 0.1586 |
Upregulated datasets: 0; Downregulated datasets: 0.
Survival by PDCD1 expression:
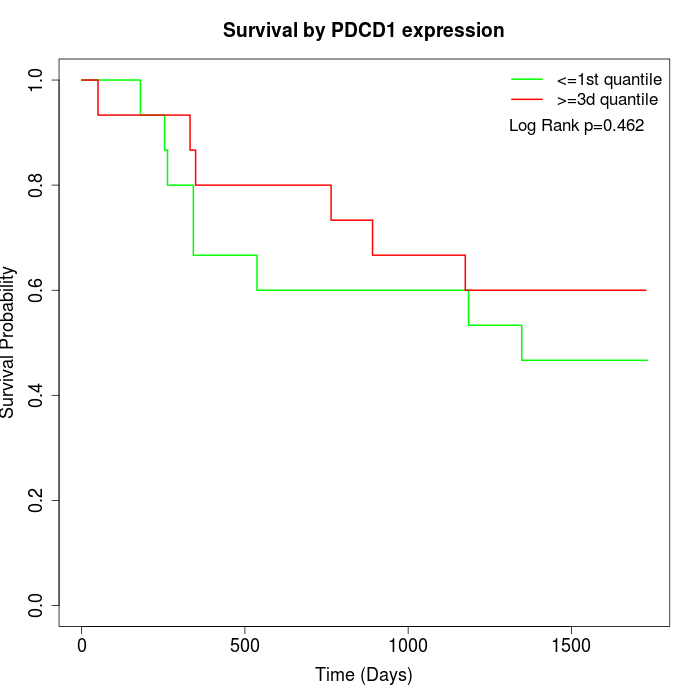 | 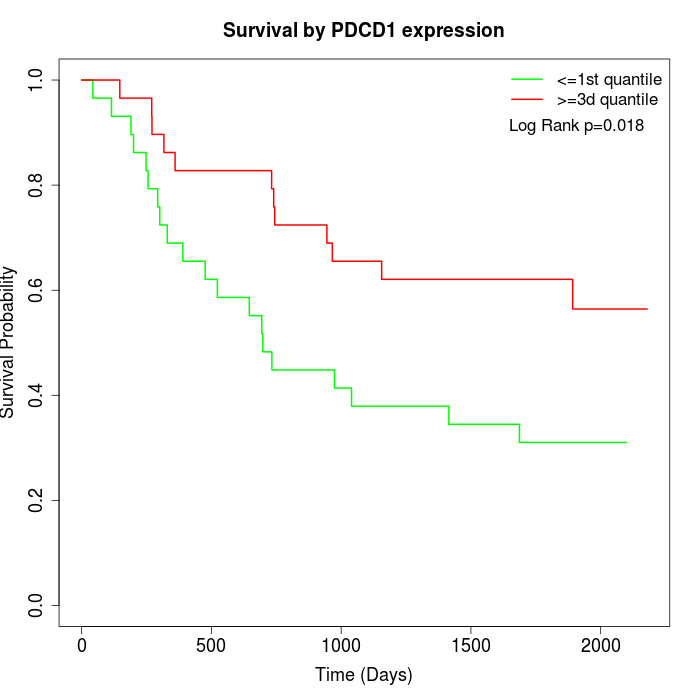 | 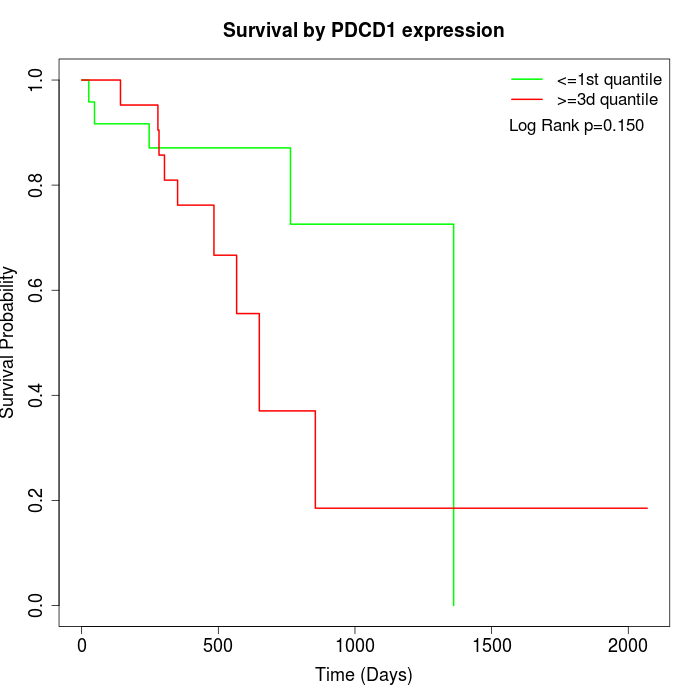 |
| GSE53622 | GSE53624 | TCGA |
Note: Click image to view full size file.
Copy number change of PDCD1:
| Dataset | Gene | EntrezID | Gain | Loss | Normal | Detail |
|---|---|---|---|---|---|---|
| GSE15526 | PDCD1 | 5133 | 1 | 12 | 17 | |
| GSE20123 | PDCD1 | 5133 | 1 | 12 | 17 | |
| GSE43470 | PDCD1 | 5133 | 1 | 9 | 33 | |
| GSE46452 | PDCD1 | 5133 | 0 | 5 | 54 | |
| GSE47630 | PDCD1 | 5133 | 4 | 5 | 31 | |
| GSE54993 | PDCD1 | 5133 | 4 | 3 | 63 | |
| GSE54994 | PDCD1 | 5133 | 8 | 9 | 36 | |
| GSE60625 | PDCD1 | 5133 | 0 | 3 | 8 | |
| GSE74703 | PDCD1 | 5133 | 1 | 7 | 28 | |
| GSE74704 | PDCD1 | 5133 | 1 | 5 | 14 | |
| TCGA | PDCD1 | 5133 | 11 | 29 | 56 |
Total number of gains: 32; Total number of losses: 99; Total Number of normals: 357.
Somatic mutations of PDCD1:
Generating mutation plots.
Highly correlated genes for PDCD1:
Showing top 20/803 corelated genes with mean PCC>0.5.
| Gene1 | Gene2 | Mean PCC | Num. Datasets | Num. PCC<0 | Num. PCC>0.5 |
|---|---|---|---|---|---|
| PDCD1 | SLC10A1 | 0.757588 | 3 | 0 | 3 |
| PDCD1 | TNFSF8 | 0.715953 | 4 | 0 | 4 |
| PDCD1 | C17orf98 | 0.713183 | 3 | 0 | 3 |
| PDCD1 | PDE3B | 0.699649 | 4 | 0 | 4 |
| PDCD1 | CYSLTR2 | 0.686347 | 3 | 0 | 3 |
| PDCD1 | CYHR1 | 0.683843 | 3 | 0 | 3 |
| PDCD1 | PTGER3 | 0.682108 | 3 | 0 | 3 |
| PDCD1 | EXOC3L4 | 0.680628 | 3 | 0 | 3 |
| PDCD1 | KCND3 | 0.679562 | 4 | 0 | 3 |
| PDCD1 | MUC13 | 0.679518 | 4 | 0 | 3 |
| PDCD1 | ERN1 | 0.677464 | 3 | 0 | 3 |
| PDCD1 | PHLDB1 | 0.668607 | 4 | 0 | 3 |
| PDCD1 | NKAIN4 | 0.667568 | 3 | 0 | 3 |
| PDCD1 | ACADS | 0.665766 | 3 | 0 | 3 |
| PDCD1 | ADM2 | 0.665442 | 6 | 0 | 6 |
| PDCD1 | MAPK11 | 0.662444 | 4 | 0 | 3 |
| PDCD1 | IL19 | 0.660734 | 4 | 0 | 3 |
| PDCD1 | MAP3K19 | 0.658177 | 4 | 0 | 4 |
| PDCD1 | LYZL6 | 0.657233 | 4 | 0 | 4 |
| PDCD1 | ATP4A | 0.652256 | 3 | 0 | 3 |
For details and further investigation, click here