| Full name: phosphatidylethanolamine binding protein 1 | Alias Symbol: RKIP|HCNP|PEBP | ||
| Type: protein-coding gene | Cytoband: 12q24.23 | ||
| Entrez ID: 5037 | HGNC ID: HGNC:8630 | Ensembl Gene: ENSG00000089220 | OMIM ID: 604591 |
| Related drugs: FLUTAMIDE, STANOLONE... [more] | |||
Expression of PEBP1:
| Dataset | Gene | EntrezID | Probe | Log2FC | Adj.pValue | Expression |
|---|---|---|---|---|---|---|
| GSE17351 | PEBP1 | 5037 | 210825_s_at | -0.2976 | 0.6100 | |
| GSE20347 | PEBP1 | 5037 | 210825_s_at | -0.6932 | 0.0001 | |
| GSE23400 | PEBP1 | 5037 | 211941_s_at | -0.7658 | 0.0000 | |
| GSE26886 | PEBP1 | 5037 | 210825_s_at | -0.6258 | 0.0033 | |
| GSE29001 | PEBP1 | 5037 | 210825_s_at | -1.0082 | 0.0018 | |
| GSE38129 | PEBP1 | 5037 | 210825_s_at | -0.5989 | 0.0000 | |
| GSE45670 | PEBP1 | 5037 | 211941_s_at | -0.8947 | 0.0000 | |
| GSE53622 | PEBP1 | 5037 | 63843 | -1.1927 | 0.0000 | |
| GSE53624 | PEBP1 | 5037 | 63843 | -1.1125 | 0.0000 | |
| GSE63941 | PEBP1 | 5037 | 211941_s_at | -1.4387 | 0.1208 | |
| GSE77861 | PEBP1 | 5037 | 210825_s_at | -0.9071 | 0.0139 | |
| GSE97050 | PEBP1 | 5037 | A_23_P13604 | -1.2404 | 0.0502 | |
| SRP007169 | PEBP1 | 5037 | RNAseq | -2.4249 | 0.0000 | |
| SRP008496 | PEBP1 | 5037 | RNAseq | -2.0494 | 0.0000 | |
| SRP064894 | PEBP1 | 5037 | RNAseq | -1.0538 | 0.0002 | |
| SRP133303 | PEBP1 | 5037 | RNAseq | -1.2962 | 0.0000 | |
| SRP159526 | PEBP1 | 5037 | RNAseq | -0.5919 | 0.0192 | |
| SRP193095 | PEBP1 | 5037 | RNAseq | -1.2707 | 0.0000 | |
| SRP219564 | PEBP1 | 5037 | RNAseq | -1.0836 | 0.0056 | |
| TCGA | PEBP1 | 5037 | RNAseq | -0.1363 | 0.0092 |
Upregulated datasets: 0; Downregulated datasets: 9.
Survival by PEBP1 expression:
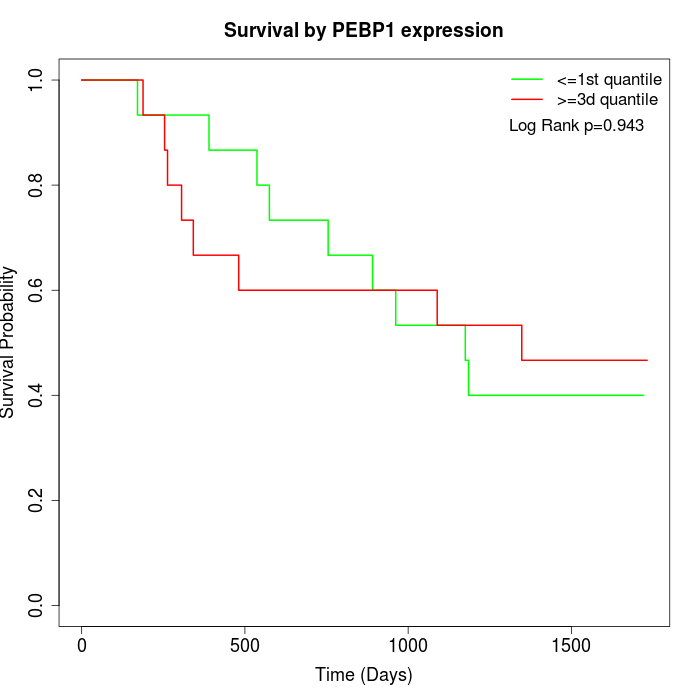 |  |  |
| GSE53622 | GSE53624 | TCGA |
Note: Click image to view full size file.
Copy number change of PEBP1:
| Dataset | Gene | EntrezID | Gain | Loss | Normal | Detail |
|---|---|---|---|---|---|---|
| GSE15526 | PEBP1 | 5037 | 6 | 2 | 22 | |
| GSE20123 | PEBP1 | 5037 | 6 | 2 | 22 | |
| GSE43470 | PEBP1 | 5037 | 2 | 1 | 40 | |
| GSE46452 | PEBP1 | 5037 | 9 | 1 | 49 | |
| GSE47630 | PEBP1 | 5037 | 9 | 3 | 28 | |
| GSE54993 | PEBP1 | 5037 | 0 | 5 | 65 | |
| GSE54994 | PEBP1 | 5037 | 6 | 6 | 41 | |
| GSE60625 | PEBP1 | 5037 | 0 | 0 | 11 | |
| GSE74703 | PEBP1 | 5037 | 2 | 0 | 34 | |
| GSE74704 | PEBP1 | 5037 | 3 | 2 | 15 | |
| TCGA | PEBP1 | 5037 | 21 | 10 | 65 |
Total number of gains: 64; Total number of losses: 32; Total Number of normals: 392.
Somatic mutations of PEBP1:
Generating mutation plots.
Highly correlated genes for PEBP1:
Showing top 20/1314 corelated genes with mean PCC>0.5.
| Gene1 | Gene2 | Mean PCC | Num. Datasets | Num. PCC<0 | Num. PCC>0.5 |
|---|---|---|---|---|---|
| PEBP1 | MYZAP | 0.783508 | 3 | 0 | 3 |
| PEBP1 | MPP7 | 0.754863 | 6 | 0 | 6 |
| PEBP1 | HPGD | 0.73417 | 11 | 0 | 10 |
| PEBP1 | CA13 | 0.730941 | 3 | 0 | 3 |
| PEBP1 | SNX9 | 0.726917 | 7 | 0 | 7 |
| PEBP1 | GPD1L | 0.721889 | 11 | 0 | 11 |
| PEBP1 | CASC3 | 0.720965 | 3 | 0 | 3 |
| PEBP1 | KRT78 | 0.717647 | 6 | 0 | 6 |
| PEBP1 | TCP11L2 | 0.716089 | 4 | 0 | 4 |
| PEBP1 | SHROOM3 | 0.71364 | 7 | 0 | 7 |
| PEBP1 | MPC1 | 0.706362 | 10 | 0 | 10 |
| PEBP1 | LINC01315 | 0.704085 | 5 | 0 | 4 |
| PEBP1 | MORN3 | 0.703717 | 3 | 0 | 3 |
| PEBP1 | SLC10A5 | 0.699539 | 3 | 0 | 3 |
| PEBP1 | RAB11A | 0.699118 | 9 | 0 | 9 |
| PEBP1 | SPATA19 | 0.696725 | 3 | 0 | 3 |
| PEBP1 | ACOX3 | 0.692364 | 10 | 0 | 10 |
| PEBP1 | ECHDC2 | 0.691567 | 13 | 0 | 10 |
| PEBP1 | LMBRD1 | 0.690464 | 10 | 0 | 10 |
| PEBP1 | BLOC1S1 | 0.689008 | 9 | 0 | 8 |
For details and further investigation, click here