| Full name: biogenesis of lysosomal organelles complex 1 subunit 1 | Alias Symbol: BLOS1|BORCS1 | ||
| Type: protein-coding gene | Cytoband: 12q13.2 | ||
| Entrez ID: 2647 | HGNC ID: HGNC:4200 | Ensembl Gene: ENSG00000135441 | OMIM ID: 601444 |
Expression of BLOC1S1:
| Dataset | Gene | EntrezID | Probe | Log2FC | Adj.pValue | Expression |
|---|---|---|---|---|---|---|
| GSE17351 | BLOC1S1 | 2647 | 202592_at | -0.4565 | 0.2842 | |
| GSE20347 | BLOC1S1 | 2647 | 202592_at | -0.8965 | 0.0000 | |
| GSE23400 | BLOC1S1 | 2647 | 202592_at | -0.6180 | 0.0000 | |
| GSE26886 | BLOC1S1 | 2647 | 202592_at | 0.1214 | 0.5343 | |
| GSE29001 | BLOC1S1 | 2647 | 202592_at | -0.7072 | 0.0008 | |
| GSE38129 | BLOC1S1 | 2647 | 202592_at | -0.7392 | 0.0000 | |
| GSE45670 | BLOC1S1 | 2647 | 202592_at | -0.4889 | 0.0002 | |
| GSE53622 | BLOC1S1 | 2647 | 17520 | -0.9981 | 0.0000 | |
| GSE53624 | BLOC1S1 | 2647 | 17520 | -0.8262 | 0.0000 | |
| GSE63941 | BLOC1S1 | 2647 | 202592_at | 1.4419 | 0.0011 | |
| GSE77861 | BLOC1S1 | 2647 | 202592_at | -0.7647 | 0.0002 | |
| GSE97050 | BLOC1S1 | 2647 | A_33_P3388870 | -0.7955 | 0.0762 | |
| SRP007169 | BLOC1S1 | 2647 | RNAseq | -2.1842 | 0.0000 | |
| SRP008496 | BLOC1S1 | 2647 | RNAseq | -1.9479 | 0.0000 | |
| SRP064894 | BLOC1S1 | 2647 | RNAseq | -0.4388 | 0.2504 | |
| SRP133303 | BLOC1S1 | 2647 | RNAseq | -0.4953 | 0.0150 | |
| SRP159526 | BLOC1S1 | 2647 | RNAseq | -0.6949 | 0.0103 | |
| SRP193095 | BLOC1S1 | 2647 | RNAseq | -1.2785 | 0.0000 | |
| SRP219564 | BLOC1S1 | 2647 | RNAseq | -0.8047 | 0.0023 | |
| TCGA | BLOC1S1 | 2647 | RNAseq | -0.1494 | 0.0109 |
Upregulated datasets: 1; Downregulated datasets: 3.
Survival by BLOC1S1 expression:
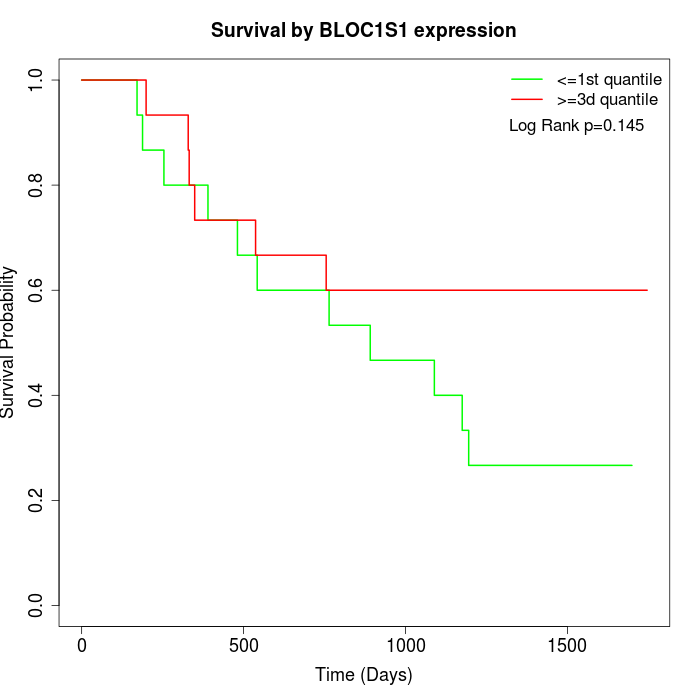 | 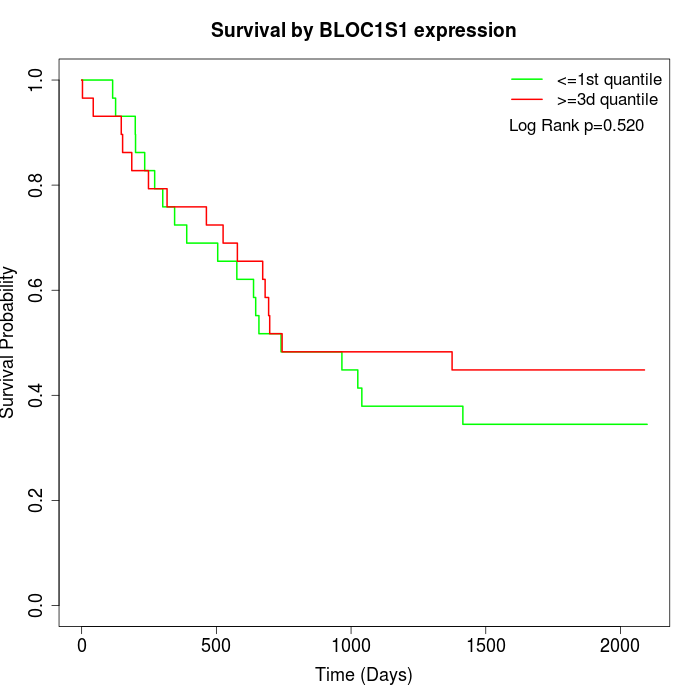 | 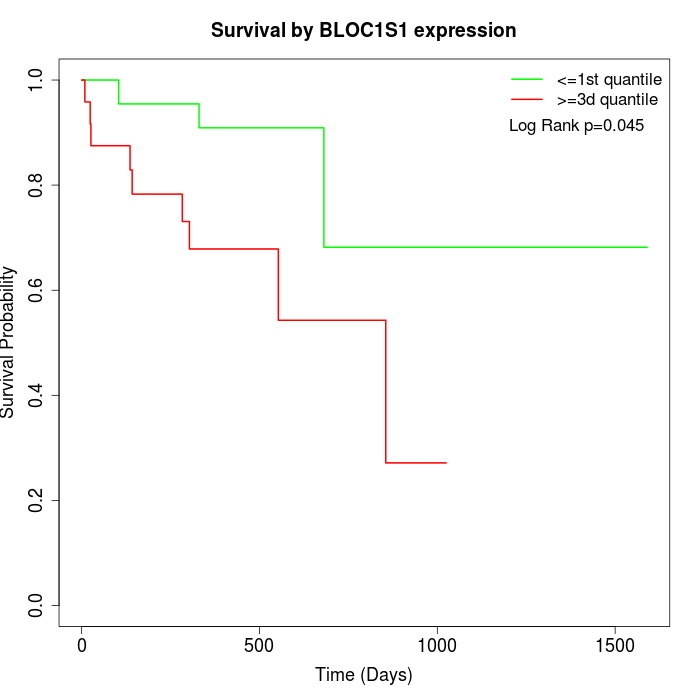 |
| GSE53622 | GSE53624 | TCGA |
Note: Click image to view full size file.
Copy number change of BLOC1S1:
| Dataset | Gene | EntrezID | Gain | Loss | Normal | Detail |
|---|---|---|---|---|---|---|
| GSE15526 | BLOC1S1 | 2647 | 6 | 1 | 23 | |
| GSE20123 | BLOC1S1 | 2647 | 6 | 1 | 23 | |
| GSE43470 | BLOC1S1 | 2647 | 4 | 0 | 39 | |
| GSE46452 | BLOC1S1 | 2647 | 8 | 1 | 50 | |
| GSE47630 | BLOC1S1 | 2647 | 10 | 2 | 28 | |
| GSE54993 | BLOC1S1 | 2647 | 0 | 5 | 65 | |
| GSE54994 | BLOC1S1 | 2647 | 4 | 1 | 48 | |
| GSE60625 | BLOC1S1 | 2647 | 0 | 0 | 11 | |
| GSE74703 | BLOC1S1 | 2647 | 4 | 0 | 32 | |
| GSE74704 | BLOC1S1 | 2647 | 4 | 1 | 15 | |
| TCGA | BLOC1S1 | 2647 | 15 | 10 | 71 |
Total number of gains: 61; Total number of losses: 22; Total Number of normals: 405.
Somatic mutations of BLOC1S1:
Generating mutation plots.
Highly correlated genes for BLOC1S1:
Showing top 20/1272 corelated genes with mean PCC>0.5.
| Gene1 | Gene2 | Mean PCC | Num. Datasets | Num. PCC<0 | Num. PCC>0.5 |
|---|---|---|---|---|---|
| BLOC1S1 | SNORA68 | 0.829858 | 3 | 0 | 3 |
| BLOC1S1 | VSIG2 | 0.804367 | 5 | 0 | 5 |
| BLOC1S1 | CGNL1 | 0.796825 | 6 | 0 | 6 |
| BLOC1S1 | SLC46A2 | 0.791731 | 5 | 0 | 5 |
| BLOC1S1 | GPD1L | 0.789162 | 10 | 0 | 10 |
| BLOC1S1 | MRPS36 | 0.783342 | 5 | 0 | 4 |
| BLOC1S1 | SFTA2 | 0.779315 | 3 | 0 | 3 |
| BLOC1S1 | STK40 | 0.776158 | 5 | 0 | 5 |
| BLOC1S1 | SH2B1 | 0.775374 | 3 | 0 | 3 |
| BLOC1S1 | PRKAR2A | 0.774065 | 5 | 0 | 5 |
| BLOC1S1 | FBXW5 | 0.772788 | 6 | 0 | 6 |
| BLOC1S1 | CLEC3B | 0.772672 | 3 | 0 | 3 |
| BLOC1S1 | PAIP2B | 0.768256 | 11 | 0 | 11 |
| BLOC1S1 | RNF10 | 0.767348 | 9 | 0 | 9 |
| BLOC1S1 | NSMCE4A | 0.766909 | 3 | 0 | 3 |
| BLOC1S1 | SHROOM3 | 0.760873 | 6 | 0 | 6 |
| BLOC1S1 | NFIA | 0.760848 | 6 | 0 | 6 |
| BLOC1S1 | CNPPD1 | 0.760651 | 9 | 0 | 9 |
| BLOC1S1 | GBP6 | 0.759159 | 3 | 0 | 3 |
| BLOC1S1 | MGST2 | 0.758817 | 11 | 0 | 10 |
For details and further investigation, click here