| Full name: phosphatidylethanolamine N-methyltransferase | Alias Symbol: PEMPT|PEMT2 | ||
| Type: protein-coding gene | Cytoband: 17p11.2 | ||
| Entrez ID: 10400 | HGNC ID: HGNC:8830 | Ensembl Gene: ENSG00000133027 | OMIM ID: 602391 |
| Related drugs: AR-20.5, CANTUZUMAB MERTANSINE, CANTUZUMAB RAVTANSINE, Pemtumomab, SONTUZUMAB, huHMFG1... [more] | |||
Expression of PEMT:
| Dataset | Gene | EntrezID | Probe | Log2FC | Adj.pValue | Expression |
|---|---|---|---|---|---|---|
| GSE17351 | PEMT | 10400 | 207621_s_at | 0.1370 | 0.7342 | |
| GSE20347 | PEMT | 10400 | 207621_s_at | 0.1500 | 0.3661 | |
| GSE23400 | PEMT | 10400 | 207621_s_at | 0.1984 | 0.0013 | |
| GSE26886 | PEMT | 10400 | 207621_s_at | 0.7927 | 0.0019 | |
| GSE29001 | PEMT | 10400 | 207621_s_at | 0.2157 | 0.5500 | |
| GSE38129 | PEMT | 10400 | 207621_s_at | 0.3678 | 0.0159 | |
| GSE45670 | PEMT | 10400 | 207621_s_at | -0.0436 | 0.8200 | |
| GSE53622 | PEMT | 10400 | 98383 | 0.4360 | 0.0000 | |
| GSE53624 | PEMT | 10400 | 98383 | 0.4184 | 0.0000 | |
| GSE63941 | PEMT | 10400 | 207621_s_at | 1.3151 | 0.0366 | |
| GSE77861 | PEMT | 10400 | 207621_s_at | 0.1710 | 0.6316 | |
| GSE97050 | PEMT | 10400 | A_23_P163955 | 0.5034 | 0.2180 | |
| SRP007169 | PEMT | 10400 | RNAseq | -0.3462 | 0.5139 | |
| SRP008496 | PEMT | 10400 | RNAseq | -0.1675 | 0.5821 | |
| SRP064894 | PEMT | 10400 | RNAseq | 0.5802 | 0.0990 | |
| SRP133303 | PEMT | 10400 | RNAseq | 0.2242 | 0.1161 | |
| SRP159526 | PEMT | 10400 | RNAseq | 0.5460 | 0.0359 | |
| SRP193095 | PEMT | 10400 | RNAseq | 0.2789 | 0.0475 | |
| SRP219564 | PEMT | 10400 | RNAseq | 0.8348 | 0.0697 | |
| TCGA | PEMT | 10400 | RNAseq | 0.2215 | 0.0071 |
Upregulated datasets: 1; Downregulated datasets: 0.
Survival by PEMT expression:
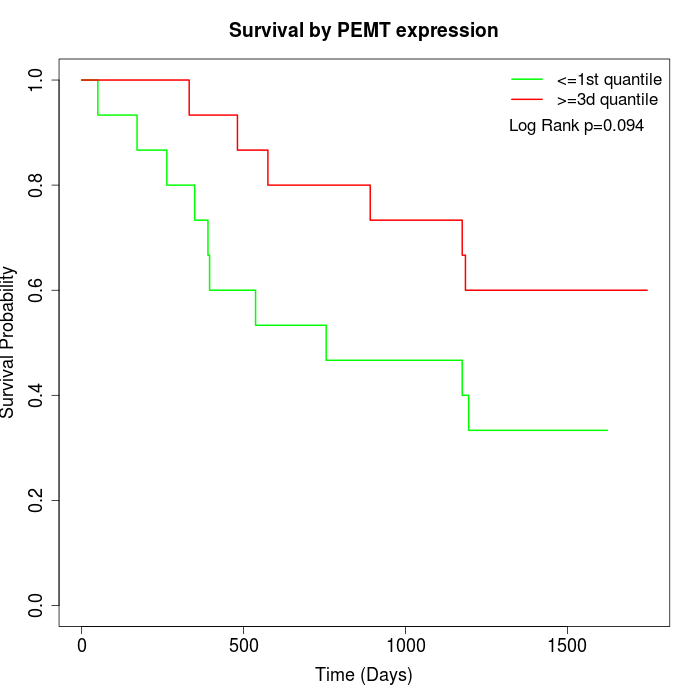 | 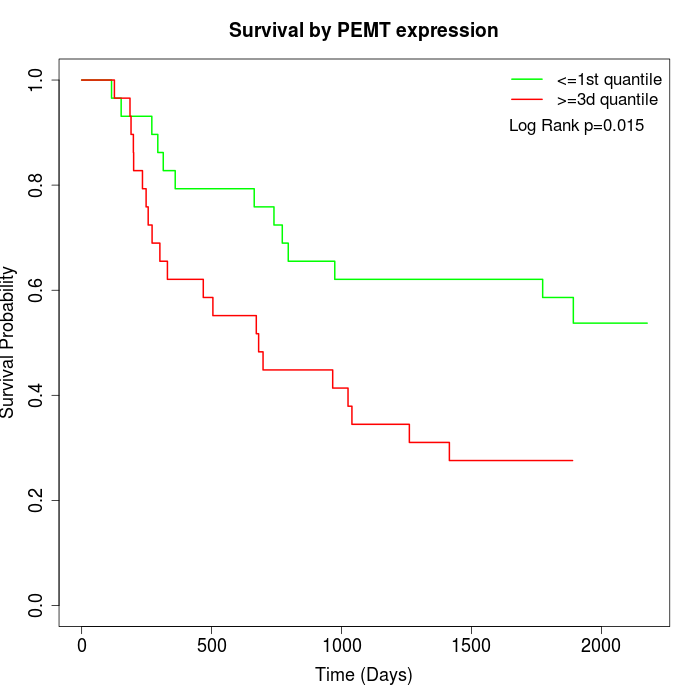 | 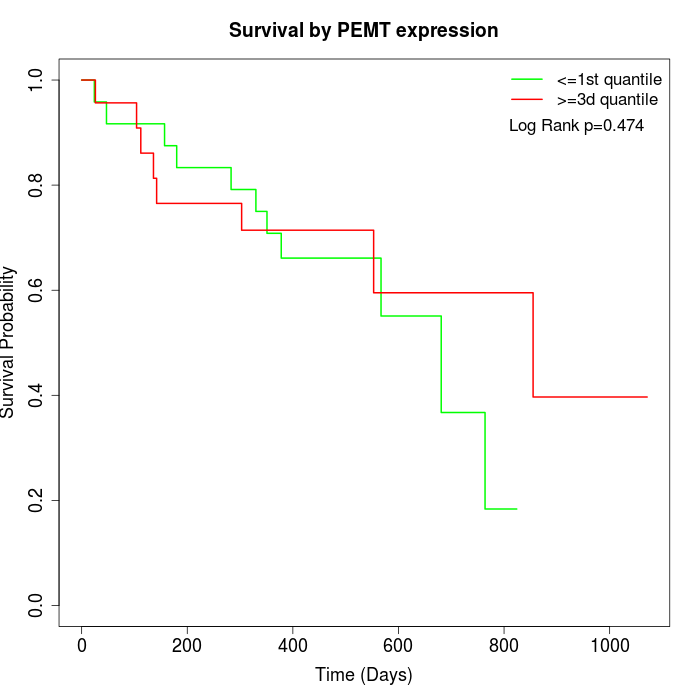 |
| GSE53622 | GSE53624 | TCGA |
Note: Click image to view full size file.
Copy number change of PEMT:
| Dataset | Gene | EntrezID | Gain | Loss | Normal | Detail |
|---|---|---|---|---|---|---|
| GSE15526 | PEMT | 10400 | 3 | 3 | 24 | |
| GSE20123 | PEMT | 10400 | 3 | 4 | 23 | |
| GSE43470 | PEMT | 10400 | 1 | 5 | 37 | |
| GSE46452 | PEMT | 10400 | 34 | 1 | 24 | |
| GSE47630 | PEMT | 10400 | 7 | 1 | 32 | |
| GSE54993 | PEMT | 10400 | 3 | 3 | 64 | |
| GSE54994 | PEMT | 10400 | 6 | 6 | 41 | |
| GSE60625 | PEMT | 10400 | 4 | 0 | 7 | |
| GSE74703 | PEMT | 10400 | 1 | 2 | 33 | |
| GSE74704 | PEMT | 10400 | 2 | 1 | 17 | |
| TCGA | PEMT | 10400 | 18 | 23 | 55 |
Total number of gains: 82; Total number of losses: 49; Total Number of normals: 357.
Somatic mutations of PEMT:
Generating mutation plots.
Highly correlated genes for PEMT:
Showing top 20/1076 corelated genes with mean PCC>0.5.
| Gene1 | Gene2 | Mean PCC | Num. Datasets | Num. PCC<0 | Num. PCC>0.5 |
|---|---|---|---|---|---|
| PEMT | KRTCAP2 | 0.803274 | 3 | 0 | 3 |
| PEMT | COMMD2 | 0.778671 | 3 | 0 | 3 |
| PEMT | PRMT6 | 0.76934 | 3 | 0 | 3 |
| PEMT | ATG4C | 0.761412 | 3 | 0 | 3 |
| PEMT | KTI12 | 0.738359 | 3 | 0 | 3 |
| PEMT | IFT22 | 0.732593 | 3 | 0 | 3 |
| PEMT | MRPL37 | 0.720907 | 5 | 0 | 4 |
| PEMT | SCO1 | 0.720099 | 4 | 0 | 4 |
| PEMT | SEC22C | 0.718741 | 4 | 0 | 4 |
| PEMT | MRPL20 | 0.715313 | 3 | 0 | 3 |
| PEMT | PTGES3 | 0.709792 | 5 | 0 | 5 |
| PEMT | MAGOHB | 0.704262 | 5 | 0 | 5 |
| PEMT | TM2D1 | 0.699241 | 3 | 0 | 3 |
| PEMT | SMARCAD1 | 0.69888 | 3 | 0 | 3 |
| PEMT | TCF19 | 0.696758 | 3 | 0 | 3 |
| PEMT | INO80B | 0.694919 | 3 | 0 | 3 |
| PEMT | CNOT10 | 0.691599 | 4 | 0 | 3 |
| PEMT | FAM160A2 | 0.690521 | 3 | 0 | 3 |
| PEMT | PHF8 | 0.683016 | 3 | 0 | 3 |
| PEMT | SLC38A10 | 0.681379 | 3 | 0 | 3 |
For details and further investigation, click here