| Full name: prostaglandin E synthase 3 | Alias Symbol: p23|TEBP|cPGES | ||
| Type: protein-coding gene | Cytoband: 12q13.3 | ||
| Entrez ID: 10728 | HGNC ID: HGNC:16049 | Ensembl Gene: ENSG00000110958 | OMIM ID: 607061 |
| Related drugs: DIETHYLSTILBESTROL, GENISTEIN... [more] | |||
Screen Evidence:
| |||
Expression of PTGES3:
| Dataset | Gene | EntrezID | Probe | Log2FC | Adj.pValue | Expression |
|---|---|---|---|---|---|---|
| GSE17351 | PTGES3 | 10728 | 200627_at | 0.2728 | 0.4578 | |
| GSE20347 | PTGES3 | 10728 | 200627_at | 0.5862 | 0.0005 | |
| GSE23400 | PTGES3 | 10728 | 200627_at | 0.5630 | 0.0000 | |
| GSE26886 | PTGES3 | 10728 | 200627_at | -0.0169 | 0.9132 | |
| GSE29001 | PTGES3 | 10728 | 200627_at | 0.4247 | 0.3465 | |
| GSE38129 | PTGES3 | 10728 | 200627_at | 0.6520 | 0.0000 | |
| GSE45670 | PTGES3 | 10728 | 200627_at | 0.2484 | 0.0414 | |
| GSE53622 | PTGES3 | 10728 | 44866 | 0.0555 | 0.2150 | |
| GSE53624 | PTGES3 | 10728 | 72972 | 0.3317 | 0.0000 | |
| GSE63941 | PTGES3 | 10728 | 200627_at | 0.5917 | 0.0016 | |
| GSE77861 | PTGES3 | 10728 | 200627_at | 0.4058 | 0.0226 | |
| GSE97050 | PTGES3 | 10728 | A_32_P114896 | 0.2740 | 0.3187 | |
| SRP007169 | PTGES3 | 10728 | RNAseq | 0.1086 | 0.7321 | |
| SRP008496 | PTGES3 | 10728 | RNAseq | 0.1288 | 0.3843 | |
| SRP064894 | PTGES3 | 10728 | RNAseq | 0.3148 | 0.0148 | |
| SRP133303 | PTGES3 | 10728 | RNAseq | 0.7051 | 0.0000 | |
| SRP159526 | PTGES3 | 10728 | RNAseq | 0.2339 | 0.3642 | |
| SRP193095 | PTGES3 | 10728 | RNAseq | 0.0810 | 0.4170 | |
| SRP219564 | PTGES3 | 10728 | RNAseq | 0.1709 | 0.5871 | |
| TCGA | PTGES3 | 10728 | RNAseq | 0.1966 | 0.0000 |
Upregulated datasets: 0; Downregulated datasets: 0.
Survival by PTGES3 expression:
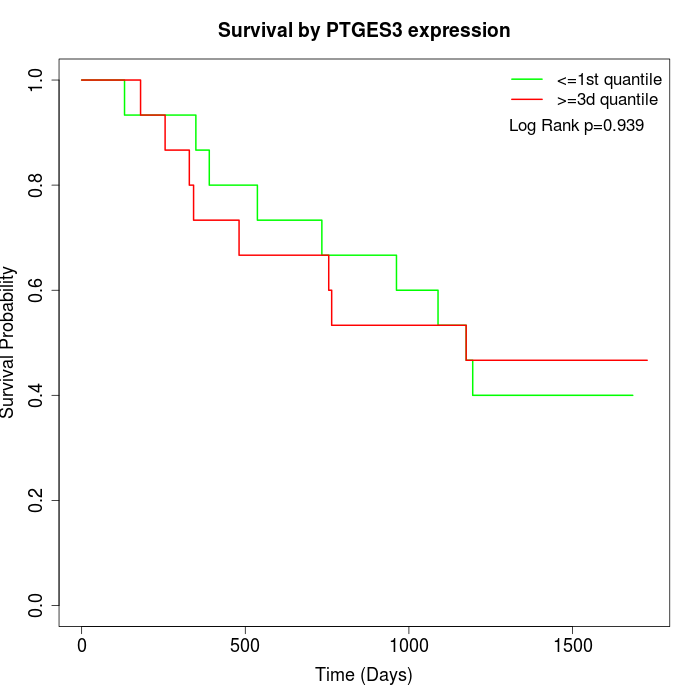 | 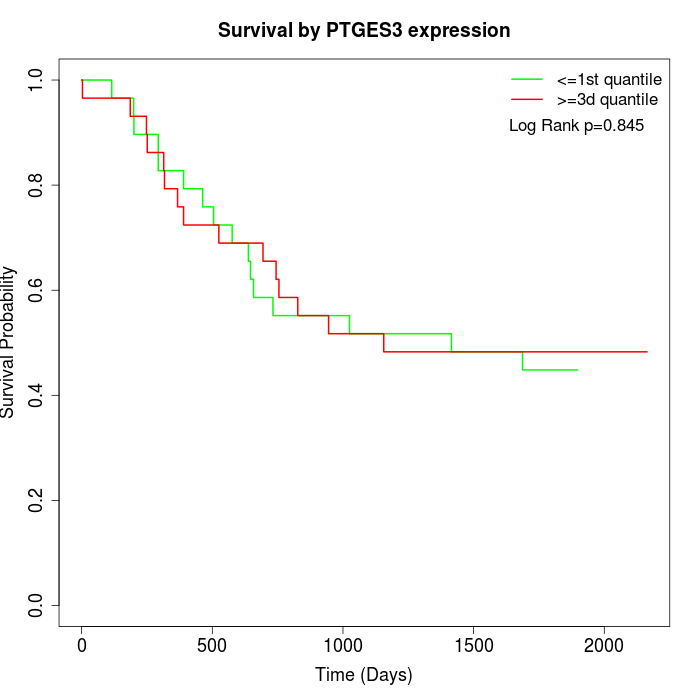 | 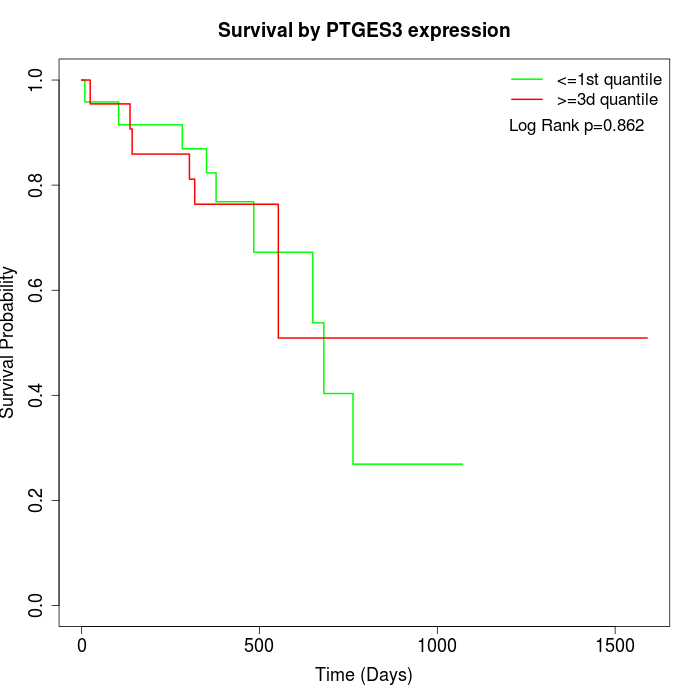 |
| GSE53622 | GSE53624 | TCGA |
Note: Click image to view full size file.
Copy number change of PTGES3:
| Dataset | Gene | EntrezID | Gain | Loss | Normal | Detail |
|---|---|---|---|---|---|---|
| GSE15526 | PTGES3 | 10728 | 7 | 2 | 21 | |
| GSE20123 | PTGES3 | 10728 | 7 | 1 | 22 | |
| GSE43470 | PTGES3 | 10728 | 3 | 0 | 40 | |
| GSE46452 | PTGES3 | 10728 | 8 | 1 | 50 | |
| GSE47630 | PTGES3 | 10728 | 10 | 2 | 28 | |
| GSE54993 | PTGES3 | 10728 | 0 | 5 | 65 | |
| GSE54994 | PTGES3 | 10728 | 4 | 1 | 48 | |
| GSE60625 | PTGES3 | 10728 | 0 | 0 | 11 | |
| GSE74703 | PTGES3 | 10728 | 3 | 0 | 33 | |
| GSE74704 | PTGES3 | 10728 | 4 | 1 | 15 | |
| TCGA | PTGES3 | 10728 | 14 | 10 | 72 |
Total number of gains: 60; Total number of losses: 23; Total Number of normals: 405.
Somatic mutations of PTGES3:
Generating mutation plots.
Highly correlated genes for PTGES3:
Showing top 20/1460 corelated genes with mean PCC>0.5.
| Gene1 | Gene2 | Mean PCC | Num. Datasets | Num. PCC<0 | Num. PCC>0.5 |
|---|---|---|---|---|---|
| PTGES3 | INO80E | 0.805165 | 3 | 0 | 3 |
| PTGES3 | BOD1 | 0.805042 | 4 | 0 | 4 |
| PTGES3 | SRP68 | 0.800797 | 3 | 0 | 3 |
| PTGES3 | USP37 | 0.799207 | 3 | 0 | 3 |
| PTGES3 | MAST1 | 0.797305 | 3 | 0 | 3 |
| PTGES3 | PRPF38A | 0.762621 | 3 | 0 | 3 |
| PTGES3 | WWP1 | 0.759115 | 3 | 0 | 3 |
| PTGES3 | COPS4 | 0.756428 | 3 | 0 | 3 |
| PTGES3 | ERCC8 | 0.750118 | 3 | 0 | 3 |
| PTGES3 | SYT17 | 0.748497 | 3 | 0 | 3 |
| PTGES3 | NACC1 | 0.743951 | 3 | 0 | 3 |
| PTGES3 | RPS19BP1 | 0.740147 | 4 | 0 | 4 |
| PTGES3 | CS | 0.738512 | 3 | 0 | 3 |
| PTGES3 | PHB | 0.734311 | 7 | 0 | 6 |
| PTGES3 | CTDSPL2 | 0.727041 | 4 | 0 | 4 |
| PTGES3 | RAVER1 | 0.719774 | 4 | 0 | 3 |
| PTGES3 | CCT4 | 0.7188 | 12 | 0 | 10 |
| PTGES3 | MBOAT1 | 0.717257 | 3 | 0 | 3 |
| PTGES3 | MIEN1 | 0.716802 | 3 | 0 | 3 |
| PTGES3 | RBMX | 0.716646 | 3 | 0 | 3 |
For details and further investigation, click here