| Full name: protein inhibitor of activated STAT 1 | Alias Symbol: GBP|GU/RH-II|ZMIZ3 | ||
| Type: protein-coding gene | Cytoband: 15q23 | ||
| Entrez ID: 8554 | HGNC ID: HGNC:2752 | Ensembl Gene: ENSG00000033800 | OMIM ID: 603566 |
Screen Evidence:
| |||
PIAS1 involved pathways:
| KEGG pathway | Description | View |
|---|---|---|
| hsa04630 | Jak-STAT signaling pathway | |
| hsa05160 | Hepatitis C |
Expression of PIAS1:
| Dataset | Gene | EntrezID | Probe | Log2FC | Adj.pValue | Expression |
|---|---|---|---|---|---|---|
| GSE17351 | PIAS1 | 8554 | 217864_s_at | -0.7172 | 0.0070 | |
| GSE20347 | PIAS1 | 8554 | 217864_s_at | -0.4670 | 0.0020 | |
| GSE23400 | PIAS1 | 8554 | 217864_s_at | -0.4875 | 0.0000 | |
| GSE26886 | PIAS1 | 8554 | 217864_s_at | -0.9822 | 0.0000 | |
| GSE29001 | PIAS1 | 8554 | 217862_at | -0.9145 | 0.0018 | |
| GSE38129 | PIAS1 | 8554 | 217864_s_at | -0.5749 | 0.0000 | |
| GSE45670 | PIAS1 | 8554 | 217864_s_at | -0.5288 | 0.0008 | |
| GSE53622 | PIAS1 | 8554 | 108018 | -0.5372 | 0.0000 | |
| GSE53624 | PIAS1 | 8554 | 108018 | -0.5551 | 0.0000 | |
| GSE63941 | PIAS1 | 8554 | 217864_s_at | 0.5552 | 0.1605 | |
| GSE77861 | PIAS1 | 8554 | 217864_s_at | -0.3472 | 0.2676 | |
| GSE97050 | PIAS1 | 8554 | A_23_P163353 | -0.6376 | 0.0835 | |
| SRP007169 | PIAS1 | 8554 | RNAseq | -1.4821 | 0.0003 | |
| SRP008496 | PIAS1 | 8554 | RNAseq | -1.5802 | 0.0000 | |
| SRP064894 | PIAS1 | 8554 | RNAseq | -0.9861 | 0.0000 | |
| SRP133303 | PIAS1 | 8554 | RNAseq | -0.5186 | 0.0004 | |
| SRP159526 | PIAS1 | 8554 | RNAseq | -1.0857 | 0.0002 | |
| SRP193095 | PIAS1 | 8554 | RNAseq | -0.7663 | 0.0000 | |
| SRP219564 | PIAS1 | 8554 | RNAseq | -0.7045 | 0.1045 | |
| TCGA | PIAS1 | 8554 | RNAseq | -0.1301 | 0.0079 |
Upregulated datasets: 0; Downregulated datasets: 3.
Survival by PIAS1 expression:
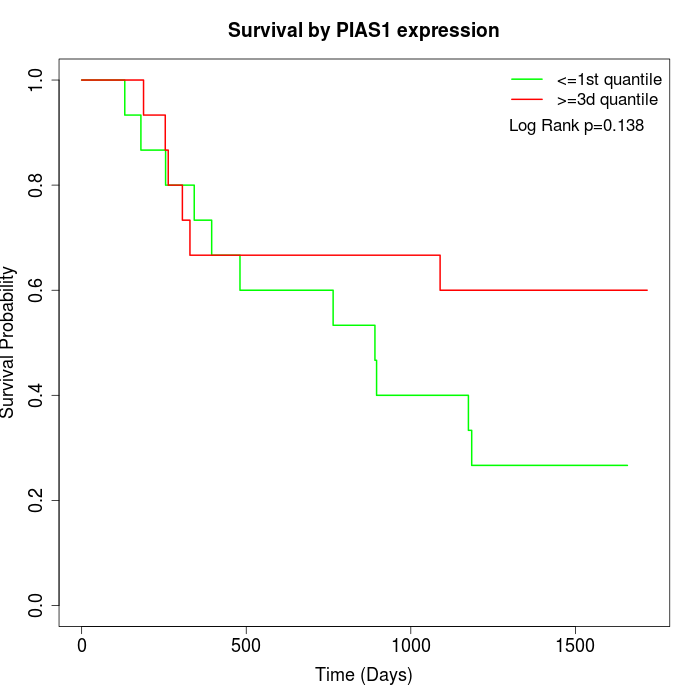 | 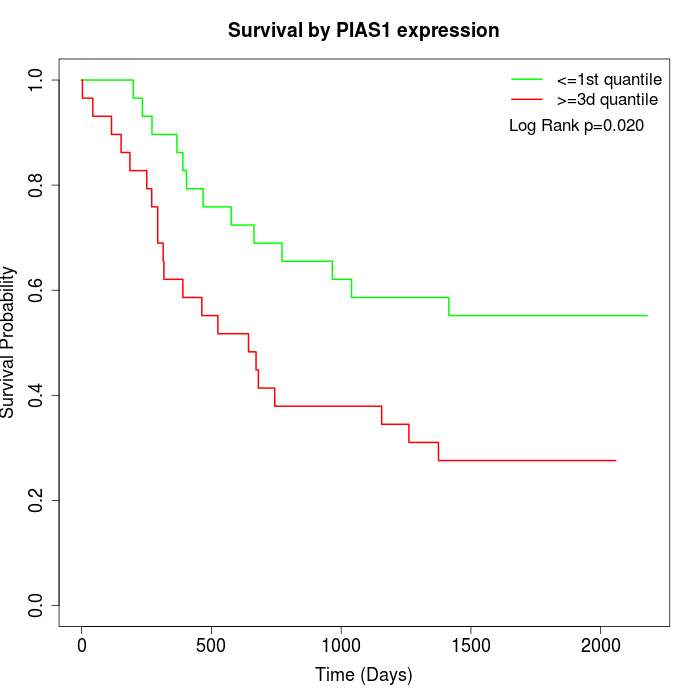 | 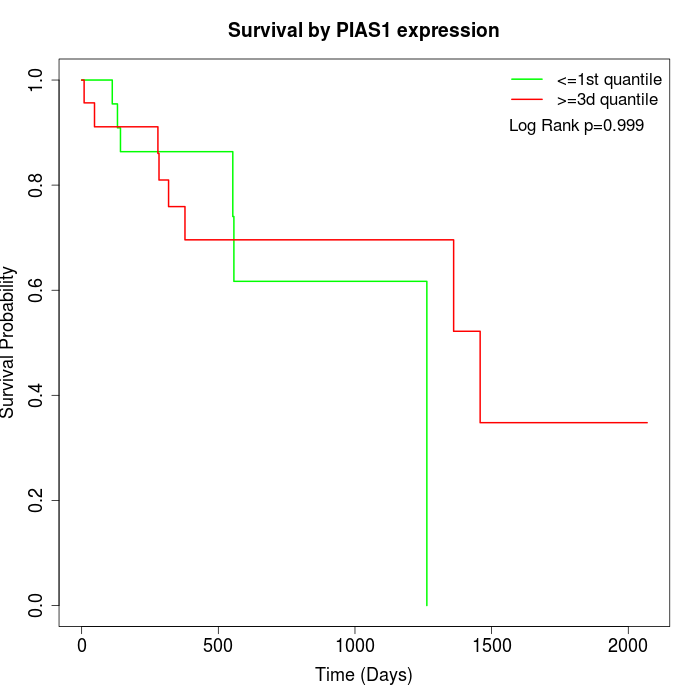 |
| GSE53622 | GSE53624 | TCGA |
Note: Click image to view full size file.
Copy number change of PIAS1:
| Dataset | Gene | EntrezID | Gain | Loss | Normal | Detail |
|---|---|---|---|---|---|---|
| GSE15526 | PIAS1 | 8554 | 7 | 1 | 22 | |
| GSE20123 | PIAS1 | 8554 | 7 | 1 | 22 | |
| GSE43470 | PIAS1 | 8554 | 4 | 6 | 33 | |
| GSE46452 | PIAS1 | 8554 | 3 | 7 | 49 | |
| GSE47630 | PIAS1 | 8554 | 8 | 10 | 22 | |
| GSE54993 | PIAS1 | 8554 | 5 | 6 | 59 | |
| GSE54994 | PIAS1 | 8554 | 5 | 7 | 41 | |
| GSE60625 | PIAS1 | 8554 | 4 | 0 | 7 | |
| GSE74703 | PIAS1 | 8554 | 4 | 3 | 29 | |
| GSE74704 | PIAS1 | 8554 | 3 | 1 | 16 | |
| TCGA | PIAS1 | 8554 | 10 | 15 | 71 |
Total number of gains: 60; Total number of losses: 57; Total Number of normals: 371.
Somatic mutations of PIAS1:
Generating mutation plots.
Highly correlated genes for PIAS1:
Showing top 20/1282 corelated genes with mean PCC>0.5.
| Gene1 | Gene2 | Mean PCC | Num. Datasets | Num. PCC<0 | Num. PCC>0.5 |
|---|---|---|---|---|---|
| PIAS1 | FAM214A | 0.795135 | 6 | 0 | 6 |
| PIAS1 | CGNL1 | 0.765132 | 7 | 0 | 7 |
| PIAS1 | SNORA68 | 0.736937 | 4 | 0 | 4 |
| PIAS1 | FAM122A | 0.730653 | 4 | 0 | 4 |
| PIAS1 | CLEC3B | 0.729717 | 3 | 0 | 3 |
| PIAS1 | YAP1 | 0.727401 | 4 | 0 | 4 |
| PIAS1 | MTMR10 | 0.724318 | 7 | 0 | 7 |
| PIAS1 | SECISBP2L | 0.723219 | 11 | 0 | 10 |
| PIAS1 | EIF4E3 | 0.720961 | 7 | 0 | 7 |
| PIAS1 | SHROOM3 | 0.714496 | 7 | 0 | 7 |
| PIAS1 | FCHO2 | 0.709962 | 7 | 0 | 7 |
| PIAS1 | LMBRD1 | 0.708865 | 11 | 0 | 11 |
| PIAS1 | SH3BGRL2 | 0.708173 | 7 | 0 | 7 |
| PIAS1 | GGA3 | 0.706987 | 4 | 0 | 4 |
| PIAS1 | ATP6V1C2 | 0.706341 | 4 | 0 | 4 |
| PIAS1 | ZNF662 | 0.704753 | 7 | 0 | 6 |
| PIAS1 | UTRN | 0.702739 | 7 | 0 | 7 |
| PIAS1 | CAB39L | 0.702457 | 11 | 0 | 10 |
| PIAS1 | UBL3 | 0.70221 | 10 | 0 | 10 |
| PIAS1 | RWDD2B | 0.700797 | 4 | 0 | 4 |
For details and further investigation, click here