| Full name: phosphatidylinositol-4,5-bisphosphate 3-kinase catalytic subunit delta | Alias Symbol: p110D | ||
| Type: protein-coding gene | Cytoband: 1p36.22 | ||
| Entrez ID: 5293 | HGNC ID: HGNC:8977 | Ensembl Gene: ENSG00000171608 | OMIM ID: 602839 |
| Related drugs: ALPELISIB, AMG-319, APITOLISIB, AZD-6482, AZD-8186, Acalisib, BGT-226 (CHEMBL3545096), BUPARLISIB, BUPARLISIB HYDROCHLORIDE, CAL-263... [more] | |||
Screen Evidence:
| |||
PIK3CD involved pathways:
Expression of PIK3CD:
| Dataset | Gene | EntrezID | Probe | Log2FC | Adj.pValue | Expression |
|---|---|---|---|---|---|---|
| GSE17351 | PIK3CD | 5293 | 203879_at | 0.7249 | 0.0344 | |
| GSE20347 | PIK3CD | 5293 | 203879_at | 0.4166 | 0.0056 | |
| GSE23400 | PIK3CD | 5293 | 203879_at | 0.4542 | 0.0000 | |
| GSE26886 | PIK3CD | 5293 | 203879_at | 0.8260 | 0.0111 | |
| GSE29001 | PIK3CD | 5293 | 203879_at | 0.4918 | 0.1337 | |
| GSE38129 | PIK3CD | 5293 | 203879_at | 0.3368 | 0.0552 | |
| GSE45670 | PIK3CD | 5293 | 203879_at | 0.4708 | 0.0238 | |
| GSE53622 | PIK3CD | 5293 | 61283 | -0.0034 | 0.9695 | |
| GSE53624 | PIK3CD | 5293 | 61283 | 0.0670 | 0.3679 | |
| GSE63941 | PIK3CD | 5293 | 203879_at | -0.6251 | 0.4439 | |
| GSE77861 | PIK3CD | 5293 | 203879_at | 0.1953 | 0.1568 | |
| GSE97050 | PIK3CD | 5293 | A_33_P3353941 | 0.1663 | 0.6194 | |
| SRP007169 | PIK3CD | 5293 | RNAseq | 1.1176 | 0.0456 | |
| SRP008496 | PIK3CD | 5293 | RNAseq | 0.8175 | 0.0556 | |
| SRP064894 | PIK3CD | 5293 | RNAseq | 0.7339 | 0.0000 | |
| SRP133303 | PIK3CD | 5293 | RNAseq | 0.0238 | 0.9216 | |
| SRP159526 | PIK3CD | 5293 | RNAseq | 0.3411 | 0.4117 | |
| SRP193095 | PIK3CD | 5293 | RNAseq | 0.8651 | 0.0000 | |
| SRP219564 | PIK3CD | 5293 | RNAseq | -0.2447 | 0.5259 | |
| TCGA | PIK3CD | 5293 | RNAseq | 0.2849 | 0.0011 |
Upregulated datasets: 1; Downregulated datasets: 0.
Survival by PIK3CD expression:
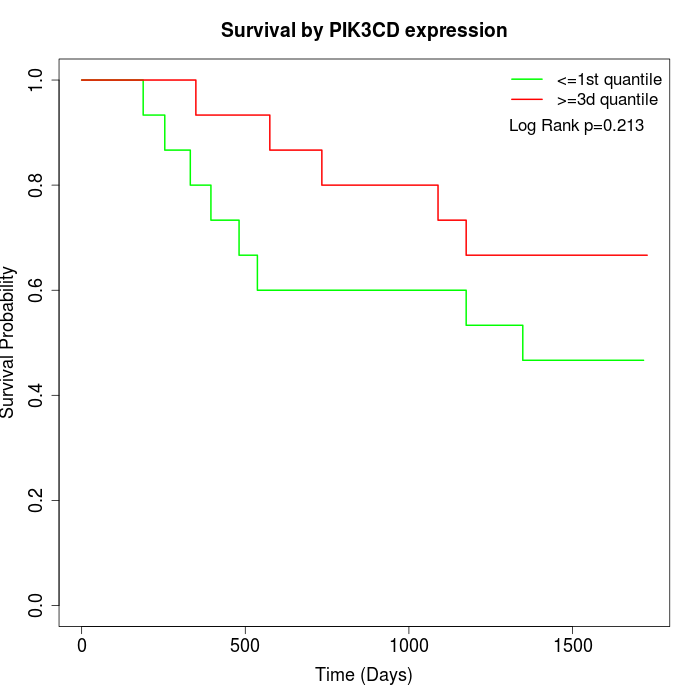 | 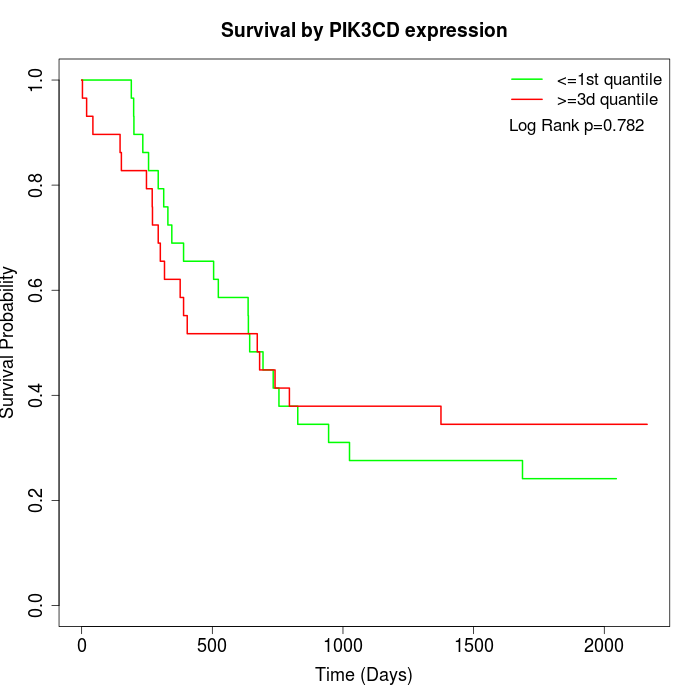 | 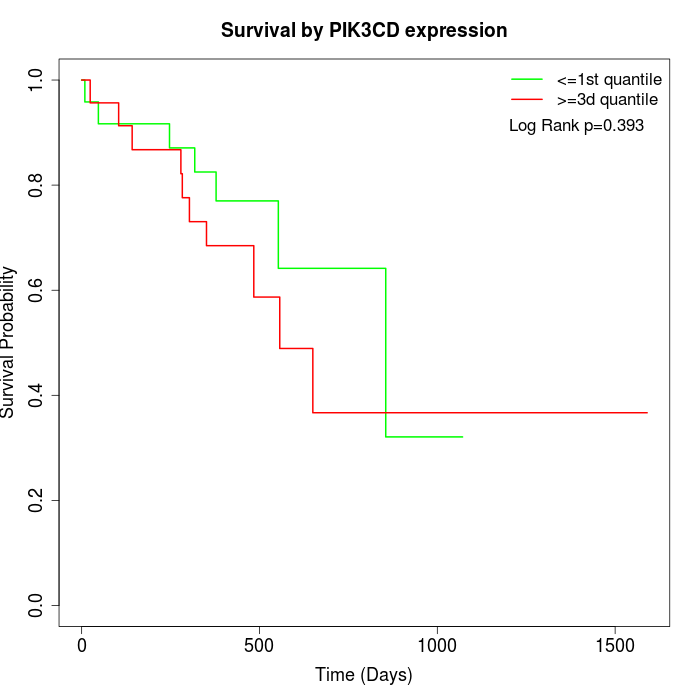 |
| GSE53622 | GSE53624 | TCGA |
Note: Click image to view full size file.
Copy number change of PIK3CD:
| Dataset | Gene | EntrezID | Gain | Loss | Normal | Detail |
|---|---|---|---|---|---|---|
| GSE15526 | PIK3CD | 5293 | 1 | 5 | 24 | |
| GSE20123 | PIK3CD | 5293 | 1 | 3 | 26 | |
| GSE43470 | PIK3CD | 5293 | 6 | 5 | 32 | |
| GSE46452 | PIK3CD | 5293 | 7 | 1 | 51 | |
| GSE47630 | PIK3CD | 5293 | 8 | 4 | 28 | |
| GSE54993 | PIK3CD | 5293 | 3 | 2 | 65 | |
| GSE54994 | PIK3CD | 5293 | 13 | 4 | 36 | |
| GSE60625 | PIK3CD | 5293 | 0 | 0 | 11 | |
| GSE74703 | PIK3CD | 5293 | 5 | 3 | 28 | |
| GSE74704 | PIK3CD | 5293 | 1 | 0 | 19 | |
| TCGA | PIK3CD | 5293 | 10 | 24 | 62 |
Total number of gains: 55; Total number of losses: 51; Total Number of normals: 382.
Somatic mutations of PIK3CD:
Generating mutation plots.
Highly correlated genes for PIK3CD:
Showing top 20/337 corelated genes with mean PCC>0.5.
| Gene1 | Gene2 | Mean PCC | Num. Datasets | Num. PCC<0 | Num. PCC>0.5 |
|---|---|---|---|---|---|
| PIK3CD | OR7A17 | 0.742543 | 3 | 0 | 3 |
| PIK3CD | TNFRSF18 | 0.737908 | 3 | 0 | 3 |
| PIK3CD | COL27A1 | 0.713603 | 5 | 0 | 4 |
| PIK3CD | ZSCAN5A | 0.706869 | 3 | 0 | 3 |
| PIK3CD | DCBLD1 | 0.702056 | 3 | 0 | 3 |
| PIK3CD | CD276 | 0.695524 | 5 | 0 | 5 |
| PIK3CD | PAG1 | 0.694673 | 5 | 0 | 4 |
| PIK3CD | PMEPA1 | 0.679681 | 9 | 0 | 8 |
| PIK3CD | LHX1 | 0.678147 | 3 | 0 | 3 |
| PIK3CD | SALL4 | 0.674191 | 4 | 0 | 3 |
| PIK3CD | SNX10 | 0.667419 | 7 | 0 | 6 |
| PIK3CD | RWDD3 | 0.661063 | 4 | 0 | 3 |
| PIK3CD | LINC00869 | 0.655244 | 3 | 0 | 3 |
| PIK3CD | ANKRD39 | 0.6545 | 3 | 0 | 3 |
| PIK3CD | MIB2 | 0.652818 | 4 | 0 | 3 |
| PIK3CD | CTHRC1 | 0.652289 | 5 | 0 | 4 |
| PIK3CD | LYPD1 | 0.649484 | 4 | 0 | 4 |
| PIK3CD | RGP1 | 0.646991 | 3 | 0 | 3 |
| PIK3CD | WRAP53 | 0.644682 | 5 | 0 | 4 |
| PIK3CD | HOXC10 | 0.642804 | 4 | 0 | 3 |
For details and further investigation, click here