| Full name: phosphoprotein membrane anchor with glycosphingolipid microdomains 1 | Alias Symbol: PAG|CBP | ||
| Type: protein-coding gene | Cytoband: 8q21.13 | ||
| Entrez ID: 55824 | HGNC ID: HGNC:30043 | Ensembl Gene: ENSG00000076641 | OMIM ID: 605767 |
Screen Evidence:
| |||
Expression of PAG1:
| Dataset | Gene | EntrezID | Probe | Log2FC | Adj.pValue | Expression |
|---|---|---|---|---|---|---|
| GSE17351 | PAG1 | 55824 | 225626_at | 0.7977 | 0.2698 | |
| GSE26886 | PAG1 | 55824 | 225626_at | 0.6187 | 0.1076 | |
| GSE45670 | PAG1 | 55824 | 225626_at | 0.5299 | 0.1403 | |
| GSE53622 | PAG1 | 55824 | 87353 | 0.5984 | 0.0000 | |
| GSE53624 | PAG1 | 55824 | 87353 | 0.5788 | 0.0000 | |
| GSE63941 | PAG1 | 55824 | 225626_at | -3.5655 | 0.0128 | |
| GSE77861 | PAG1 | 55824 | 225626_at | 1.3274 | 0.0222 | |
| GSE97050 | PAG1 | 55824 | A_33_P3216890 | 0.2674 | 0.3707 | |
| SRP007169 | PAG1 | 55824 | RNAseq | 1.0680 | 0.0113 | |
| SRP008496 | PAG1 | 55824 | RNAseq | 1.2416 | 0.0001 | |
| SRP064894 | PAG1 | 55824 | RNAseq | 0.9940 | 0.0007 | |
| SRP133303 | PAG1 | 55824 | RNAseq | 0.8090 | 0.0000 | |
| SRP159526 | PAG1 | 55824 | RNAseq | 0.2065 | 0.6901 | |
| SRP193095 | PAG1 | 55824 | RNAseq | 0.8200 | 0.0002 | |
| SRP219564 | PAG1 | 55824 | RNAseq | 0.9358 | 0.0639 | |
| TCGA | PAG1 | 55824 | RNAseq | -0.1506 | 0.1522 |
Upregulated datasets: 3; Downregulated datasets: 1.
Survival by PAG1 expression:
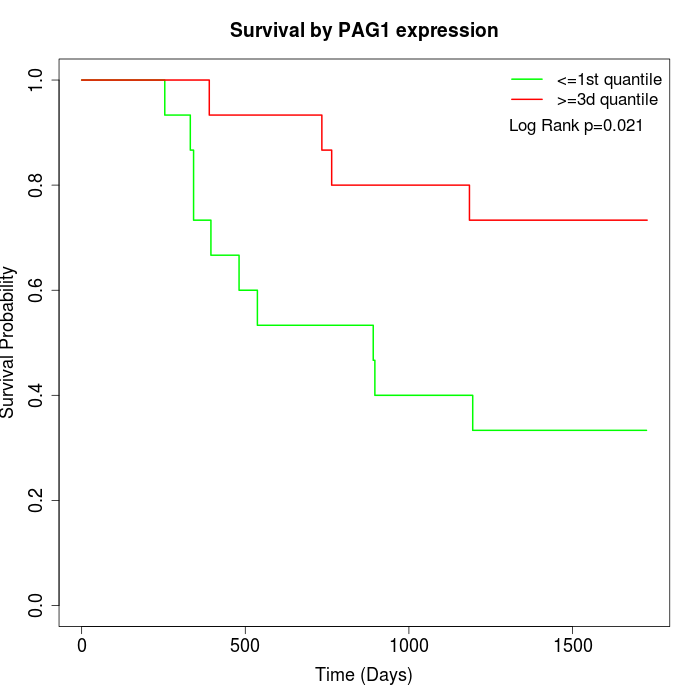 | 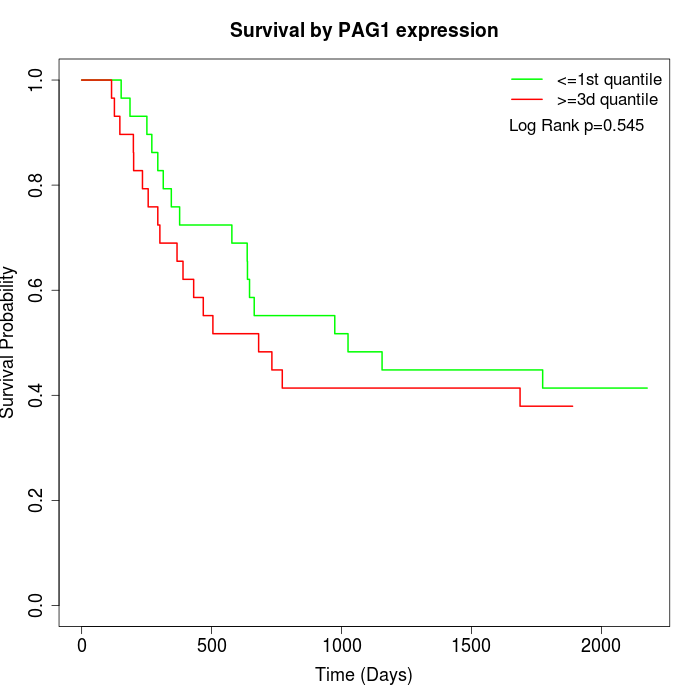 | 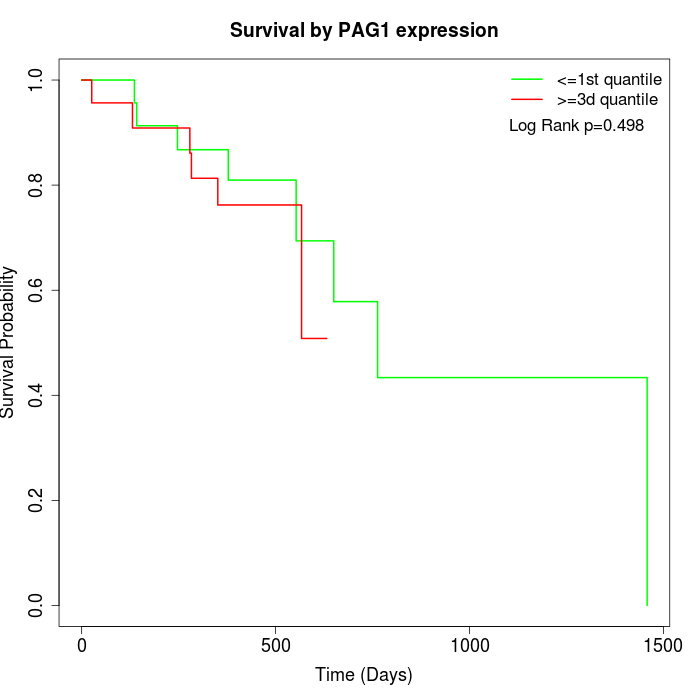 |
| GSE53622 | GSE53624 | TCGA |
Note: Click image to view full size file.
Copy number change of PAG1:
| Dataset | Gene | EntrezID | Gain | Loss | Normal | Detail |
|---|---|---|---|---|---|---|
| GSE15526 | PAG1 | 55824 | 16 | 1 | 13 | |
| GSE20123 | PAG1 | 55824 | 18 | 1 | 11 | |
| GSE43470 | PAG1 | 55824 | 18 | 1 | 24 | |
| GSE46452 | PAG1 | 55824 | 21 | 0 | 38 | |
| GSE47630 | PAG1 | 55824 | 23 | 0 | 17 | |
| GSE54993 | PAG1 | 55824 | 0 | 19 | 51 | |
| GSE54994 | PAG1 | 55824 | 29 | 0 | 24 | |
| GSE60625 | PAG1 | 55824 | 0 | 4 | 7 | |
| GSE74703 | PAG1 | 55824 | 15 | 1 | 20 | |
| GSE74704 | PAG1 | 55824 | 12 | 0 | 8 | |
| TCGA | PAG1 | 55824 | 50 | 3 | 43 |
Total number of gains: 202; Total number of losses: 30; Total Number of normals: 256.
Somatic mutations of PAG1:
Generating mutation plots.
Highly correlated genes for PAG1:
Showing top 20/225 corelated genes with mean PCC>0.5.
| Gene1 | Gene2 | Mean PCC | Num. Datasets | Num. PCC<0 | Num. PCC>0.5 |
|---|---|---|---|---|---|
| PAG1 | PLXNC1 | 0.712886 | 6 | 0 | 6 |
| PAG1 | NID2 | 0.706588 | 7 | 0 | 7 |
| PAG1 | TMC8 | 0.700897 | 3 | 0 | 3 |
| PAG1 | NAT9 | 0.698998 | 3 | 0 | 3 |
| PAG1 | PIK3CD | 0.694673 | 5 | 0 | 4 |
| PAG1 | FAP | 0.693942 | 6 | 0 | 5 |
| PAG1 | SLC7A7 | 0.692123 | 6 | 0 | 6 |
| PAG1 | COL6A3 | 0.690127 | 8 | 0 | 8 |
| PAG1 | HDAC4 | 0.686347 | 3 | 0 | 3 |
| PAG1 | FMNL1 | 0.686185 | 4 | 0 | 4 |
| PAG1 | MME | 0.683503 | 4 | 0 | 4 |
| PAG1 | ARID3A | 0.683184 | 5 | 0 | 5 |
| PAG1 | S100A4 | 0.679126 | 4 | 0 | 4 |
| PAG1 | P4HA3 | 0.67048 | 5 | 0 | 4 |
| PAG1 | COL5A2 | 0.668111 | 8 | 0 | 7 |
| PAG1 | COL1A2 | 0.666672 | 7 | 0 | 5 |
| PAG1 | SNAI2 | 0.665542 | 6 | 0 | 5 |
| PAG1 | CSGALNACT2 | 0.664366 | 9 | 0 | 8 |
| PAG1 | FCGR3B | 0.663321 | 4 | 0 | 3 |
| PAG1 | TBX3 | 0.663072 | 4 | 0 | 3 |
For details and further investigation, click here