| Full name: PITH domain containing 1 | Alias Symbol: HT014|TXNL1CL | ||
| Type: protein-coding gene | Cytoband: 1p36.11 | ||
| Entrez ID: 57095 | HGNC ID: HGNC:25022 | Ensembl Gene: ENSG00000057757 | OMIM ID: |
Expression of PITHD1:
| Dataset | Gene | EntrezID | Probe | Log2FC | Adj.pValue | Expression |
|---|---|---|---|---|---|---|
| GSE17351 | PITHD1 | 57095 | 223124_s_at | -0.2640 | 0.7130 | |
| GSE26886 | PITHD1 | 57095 | 223124_s_at | -1.5151 | 0.0000 | |
| GSE45670 | PITHD1 | 57095 | 223124_s_at | -0.2686 | 0.1191 | |
| GSE53622 | PITHD1 | 57095 | 47807 | -0.7408 | 0.0000 | |
| GSE53624 | PITHD1 | 57095 | 47807 | -0.9872 | 0.0000 | |
| GSE63941 | PITHD1 | 57095 | 223124_s_at | -0.3287 | 0.2866 | |
| GSE77861 | PITHD1 | 57095 | 223124_s_at | -0.9739 | 0.0004 | |
| GSE97050 | PITHD1 | 57095 | A_23_P200073 | -0.2035 | 0.3418 | |
| SRP007169 | PITHD1 | 57095 | RNAseq | -1.1334 | 0.0278 | |
| SRP008496 | PITHD1 | 57095 | RNAseq | -0.8471 | 0.0458 | |
| SRP064894 | PITHD1 | 57095 | RNAseq | -0.4438 | 0.0034 | |
| SRP133303 | PITHD1 | 57095 | RNAseq | -0.3810 | 0.0404 | |
| SRP159526 | PITHD1 | 57095 | RNAseq | -0.4980 | 0.0040 | |
| SRP193095 | PITHD1 | 57095 | RNAseq | -0.8376 | 0.0000 | |
| SRP219564 | PITHD1 | 57095 | RNAseq | -0.4382 | 0.0280 |
Upregulated datasets: 0; Downregulated datasets: 2.
Survival by PITHD1 expression:
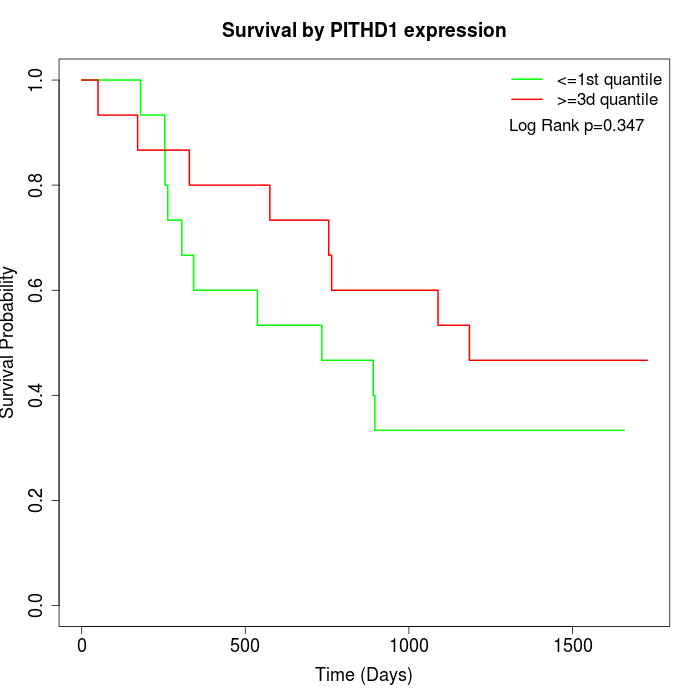 |  |
| GSE53622 | GSE53624 |
Note: Click image to view full size file.
Copy number change of PITHD1:
| Dataset | Gene | EntrezID | Gain | Loss | Normal | Detail |
|---|---|---|---|---|---|---|
| GSE15526 | PITHD1 | 57095 | 0 | 5 | 25 | |
| GSE20123 | PITHD1 | 57095 | 0 | 4 | 26 | |
| GSE43470 | PITHD1 | 57095 | 2 | 6 | 35 | |
| GSE46452 | PITHD1 | 57095 | 5 | 1 | 53 | |
| GSE47630 | PITHD1 | 57095 | 8 | 3 | 29 | |
| GSE54993 | PITHD1 | 57095 | 2 | 1 | 67 | |
| GSE54994 | PITHD1 | 57095 | 11 | 4 | 38 | |
| GSE60625 | PITHD1 | 57095 | 0 | 0 | 11 | |
| GSE74703 | PITHD1 | 57095 | 1 | 4 | 31 | |
| GSE74704 | PITHD1 | 57095 | 0 | 0 | 20 | |
| TCGA | PITHD1 | 57095 | 9 | 24 | 63 |
Total number of gains: 38; Total number of losses: 52; Total Number of normals: 398.
Somatic mutations of PITHD1:
Generating mutation plots.
Highly correlated genes for PITHD1:
Showing top 20/1596 corelated genes with mean PCC>0.5.
| Gene1 | Gene2 | Mean PCC | Num. Datasets | Num. PCC<0 | Num. PCC>0.5 |
|---|---|---|---|---|---|
| PITHD1 | ACAA1 | 0.839318 | 4 | 0 | 4 |
| PITHD1 | GGA3 | 0.821659 | 3 | 0 | 3 |
| PITHD1 | RHBDF1 | 0.81788 | 3 | 0 | 3 |
| PITHD1 | ZFC3H1 | 0.810924 | 3 | 0 | 3 |
| PITHD1 | SRP68 | 0.810249 | 4 | 0 | 4 |
| PITHD1 | DHRS1 | 0.801895 | 5 | 0 | 5 |
| PITHD1 | ALG6 | 0.799132 | 3 | 0 | 3 |
| PITHD1 | ZNF416 | 0.797359 | 5 | 0 | 5 |
| PITHD1 | SLC16A6 | 0.786912 | 6 | 0 | 6 |
| PITHD1 | CLIC3 | 0.779669 | 3 | 0 | 3 |
| PITHD1 | CPPED1 | 0.777318 | 6 | 0 | 6 |
| PITHD1 | GOLGA4 | 0.776688 | 4 | 0 | 4 |
| PITHD1 | SLC12A6 | 0.774827 | 3 | 0 | 3 |
| PITHD1 | GLYR1 | 0.773503 | 3 | 0 | 3 |
| PITHD1 | INPP1 | 0.772981 | 6 | 0 | 6 |
| PITHD1 | CGGBP1 | 0.772914 | 4 | 0 | 4 |
| PITHD1 | TPD52L2 | 0.772831 | 3 | 0 | 3 |
| PITHD1 | NAGK | 0.770784 | 6 | 0 | 6 |
| PITHD1 | FAM174A | 0.770184 | 6 | 0 | 6 |
| PITHD1 | SMURF1 | 0.769343 | 3 | 0 | 3 |
For details and further investigation, click here