| Full name: paired like homeodomain 1 | Alias Symbol: PTX1|POTX | ||
| Type: protein-coding gene | Cytoband: 5q31.1 | ||
| Entrez ID: 5307 | HGNC ID: HGNC:9004 | Ensembl Gene: ENSG00000069011 | OMIM ID: 602149 |
Expression of PITX1:
| Dataset | Gene | EntrezID | Probe | Log2FC | Adj.pValue | Expression |
|---|---|---|---|---|---|---|
| GSE17351 | PITX1 | 5307 | 208502_s_at | -1.4602 | 0.1070 | |
| GSE20347 | PITX1 | 5307 | 208502_s_at | -2.2903 | 0.0000 | |
| GSE23400 | PITX1 | 5307 | 208502_s_at | -2.2840 | 0.0000 | |
| GSE26886 | PITX1 | 5307 | 209587_at | -3.4347 | 0.0000 | |
| GSE29001 | PITX1 | 5307 | 209587_at | -2.9810 | 0.0001 | |
| GSE38129 | PITX1 | 5307 | 208502_s_at | -1.4452 | 0.0150 | |
| GSE45670 | PITX1 | 5307 | 208502_s_at | -0.8788 | 0.0205 | |
| GSE53622 | PITX1 | 5307 | 27207 | -1.9171 | 0.0000 | |
| GSE53624 | PITX1 | 5307 | 27207 | -2.4101 | 0.0000 | |
| GSE63941 | PITX1 | 5307 | 208502_s_at | -0.7735 | 0.3983 | |
| GSE77861 | PITX1 | 5307 | 208502_s_at | -1.9255 | 0.0032 | |
| GSE97050 | PITX1 | 5307 | A_33_P3240333 | -0.3718 | 0.6391 | |
| SRP007169 | PITX1 | 5307 | RNAseq | -4.4083 | 0.0000 | |
| SRP008496 | PITX1 | 5307 | RNAseq | -4.2912 | 0.0000 | |
| SRP064894 | PITX1 | 5307 | RNAseq | -2.7663 | 0.0000 | |
| SRP133303 | PITX1 | 5307 | RNAseq | -2.5340 | 0.0000 | |
| SRP159526 | PITX1 | 5307 | RNAseq | -2.5219 | 0.0003 | |
| SRP193095 | PITX1 | 5307 | RNAseq | -2.5175 | 0.0000 | |
| SRP219564 | PITX1 | 5307 | RNAseq | -3.3846 | 0.0006 | |
| TCGA | PITX1 | 5307 | RNAseq | 0.2662 | 0.0608 |
Upregulated datasets: 0; Downregulated datasets: 15.
Survival by PITX1 expression:
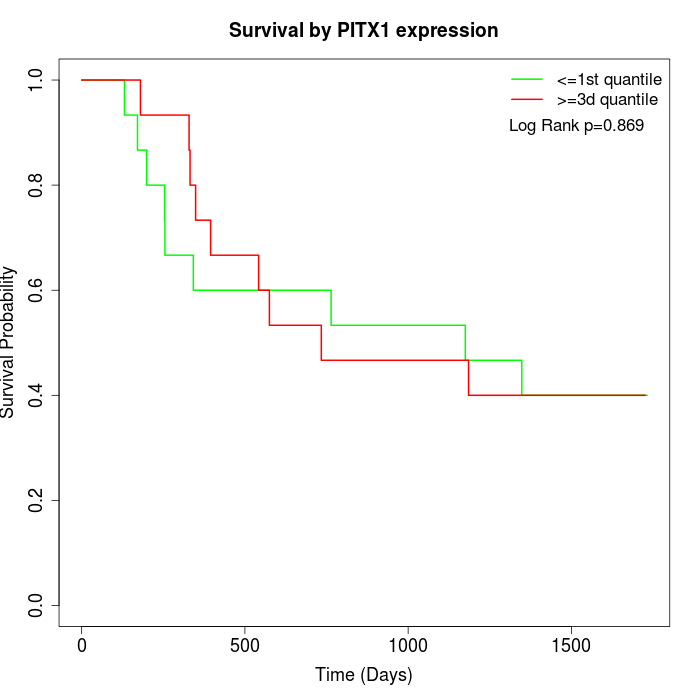 | 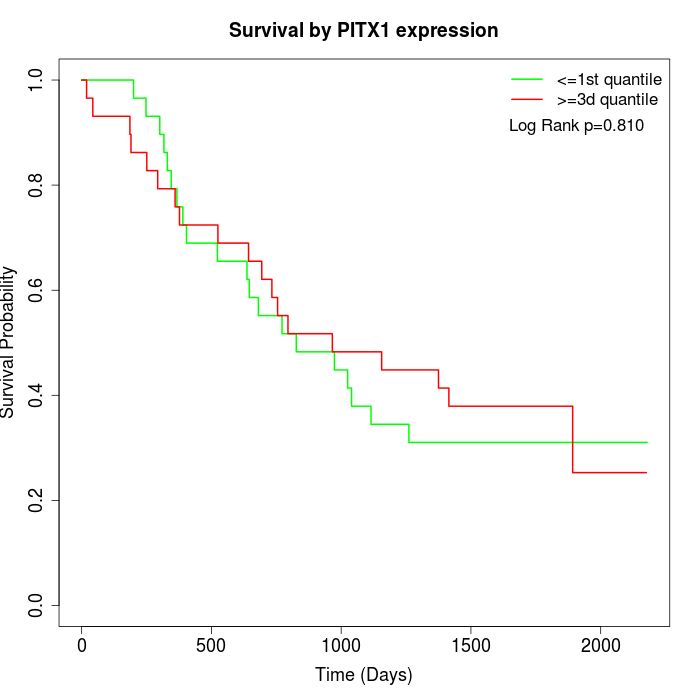 | 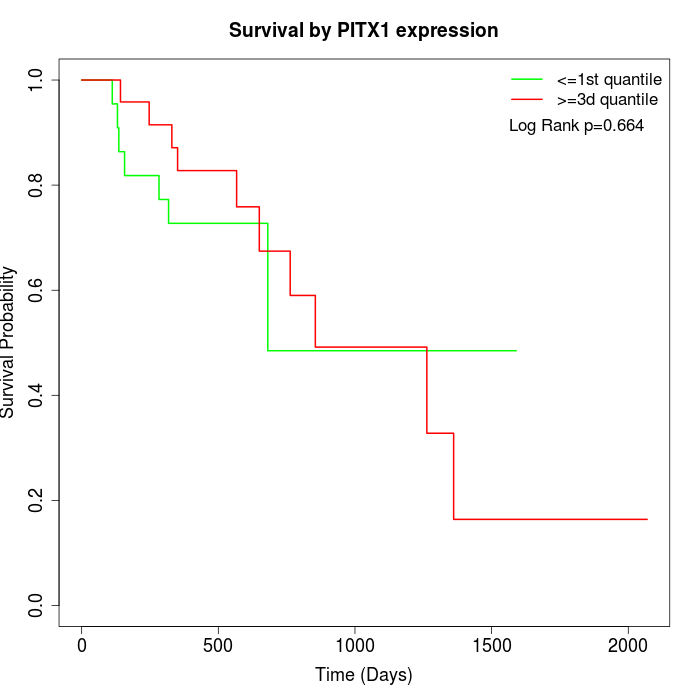 |
| GSE53622 | GSE53624 | TCGA |
Note: Click image to view full size file.
Copy number change of PITX1:
| Dataset | Gene | EntrezID | Gain | Loss | Normal | Detail |
|---|---|---|---|---|---|---|
| GSE15526 | PITX1 | 5307 | 3 | 11 | 16 | |
| GSE20123 | PITX1 | 5307 | 4 | 11 | 15 | |
| GSE43470 | PITX1 | 5307 | 4 | 6 | 33 | |
| GSE46452 | PITX1 | 5307 | 0 | 27 | 32 | |
| GSE47630 | PITX1 | 5307 | 0 | 21 | 19 | |
| GSE54993 | PITX1 | 5307 | 9 | 1 | 60 | |
| GSE54994 | PITX1 | 5307 | 3 | 13 | 37 | |
| GSE60625 | PITX1 | 5307 | 0 | 0 | 11 | |
| GSE74703 | PITX1 | 5307 | 3 | 4 | 29 | |
| GSE74704 | PITX1 | 5307 | 3 | 5 | 12 | |
| TCGA | PITX1 | 5307 | 3 | 36 | 57 |
Total number of gains: 32; Total number of losses: 135; Total Number of normals: 321.
Somatic mutations of PITX1:
Generating mutation plots.
Highly correlated genes for PITX1:
Showing top 20/1658 corelated genes with mean PCC>0.5.
| Gene1 | Gene2 | Mean PCC | Num. Datasets | Num. PCC<0 | Num. PCC>0.5 |
|---|---|---|---|---|---|
| PITX1 | C5orf66-AS1 | 0.860979 | 7 | 0 | 6 |
| PITX1 | CYSRT1 | 0.840839 | 6 | 0 | 6 |
| PITX1 | SNORA68 | 0.839063 | 4 | 0 | 4 |
| PITX1 | PPL | 0.831524 | 12 | 0 | 11 |
| PITX1 | MGST2 | 0.824265 | 10 | 0 | 10 |
| PITX1 | FUT3 | 0.819697 | 12 | 0 | 12 |
| PITX1 | HCG22 | 0.815399 | 6 | 0 | 6 |
| PITX1 | TMEM40 | 0.814402 | 11 | 0 | 11 |
| PITX1 | EPS8L2 | 0.81427 | 11 | 0 | 11 |
| PITX1 | ACPP | 0.813415 | 12 | 0 | 11 |
| PITX1 | TTC9 | 0.812051 | 11 | 0 | 11 |
| PITX1 | EXPH5 | 0.810839 | 11 | 0 | 11 |
| PITX1 | SMAGP | 0.810505 | 12 | 0 | 11 |
| PITX1 | CSTB | 0.810268 | 12 | 0 | 11 |
| PITX1 | CXCR2 | 0.809687 | 10 | 0 | 10 |
| PITX1 | KIAA1211L | 0.806957 | 6 | 0 | 6 |
| PITX1 | UPK3B | 0.803413 | 3 | 0 | 3 |
| PITX1 | EPHX3 | 0.80196 | 11 | 0 | 11 |
| PITX1 | TRIM29 | 0.801333 | 11 | 0 | 11 |
| PITX1 | ZNF185 | 0.798734 | 12 | 0 | 11 |
For details and further investigation, click here