| Full name: cAMP-dependent protein kinase inhibitor beta | Alias Symbol: | ||
| Type: protein-coding gene | Cytoband: 6q22.31 | ||
| Entrez ID: 5570 | HGNC ID: HGNC:9018 | Ensembl Gene: ENSG00000135549 | OMIM ID: 606914 |
Expression of PKIB:
| Dataset | Gene | EntrezID | Probe | Log2FC | Adj.pValue | Expression |
|---|---|---|---|---|---|---|
| GSE17351 | PKIB | 5570 | 223551_at | -0.9728 | 0.4302 | |
| GSE26886 | PKIB | 5570 | 223551_at | -1.3538 | 0.0172 | |
| GSE45670 | PKIB | 5570 | 223551_at | -1.7594 | 0.0001 | |
| GSE53622 | PKIB | 5570 | 29580 | -1.8930 | 0.0000 | |
| GSE53624 | PKIB | 5570 | 29580 | -2.1684 | 0.0000 | |
| GSE63941 | PKIB | 5570 | 223551_at | 0.8279 | 0.6318 | |
| GSE77861 | PKIB | 5570 | 223551_at | -0.6437 | 0.1513 | |
| GSE97050 | PKIB | 5570 | A_23_P145529 | 0.1501 | 0.5656 | |
| SRP007169 | PKIB | 5570 | RNAseq | -2.7810 | 0.0000 | |
| SRP064894 | PKIB | 5570 | RNAseq | -1.6151 | 0.0000 | |
| SRP133303 | PKIB | 5570 | RNAseq | -0.4501 | 0.2908 | |
| SRP159526 | PKIB | 5570 | RNAseq | -1.1436 | 0.0101 | |
| SRP193095 | PKIB | 5570 | RNAseq | -1.9598 | 0.0000 | |
| SRP219564 | PKIB | 5570 | RNAseq | -2.3856 | 0.0008 | |
| TCGA | PKIB | 5570 | RNAseq | -1.3061 | 0.0000 |
Upregulated datasets: 0; Downregulated datasets: 10.
Survival by PKIB expression:
 | 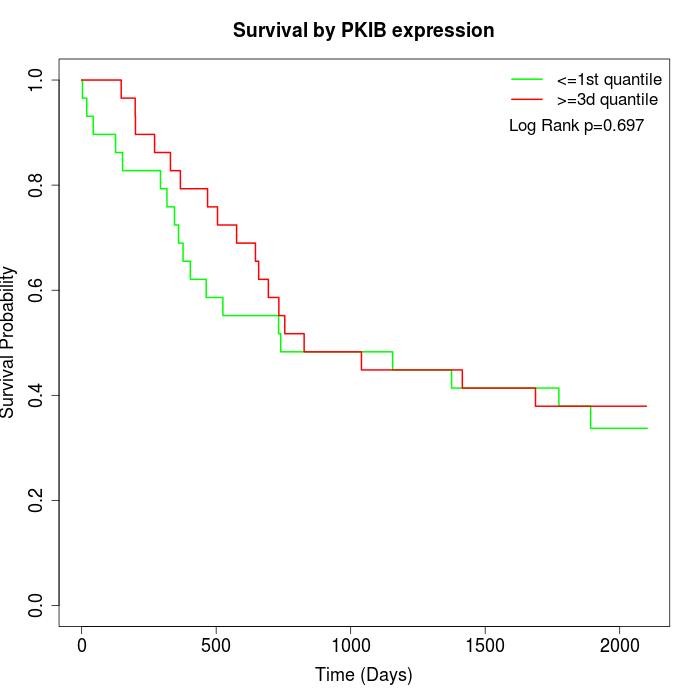 | 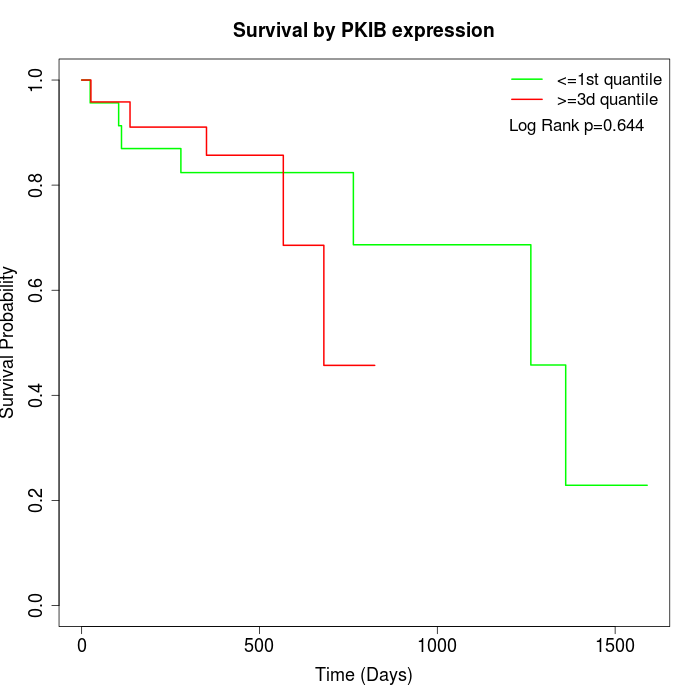 |
| GSE53622 | GSE53624 | TCGA |
Note: Click image to view full size file.
Copy number change of PKIB:
| Dataset | Gene | EntrezID | Gain | Loss | Normal | Detail |
|---|---|---|---|---|---|---|
| GSE15526 | PKIB | 5570 | 1 | 4 | 25 | |
| GSE20123 | PKIB | 5570 | 1 | 3 | 26 | |
| GSE43470 | PKIB | 5570 | 5 | 1 | 37 | |
| GSE46452 | PKIB | 5570 | 2 | 11 | 46 | |
| GSE47630 | PKIB | 5570 | 9 | 4 | 27 | |
| GSE54993 | PKIB | 5570 | 3 | 2 | 65 | |
| GSE54994 | PKIB | 5570 | 8 | 8 | 37 | |
| GSE60625 | PKIB | 5570 | 0 | 1 | 10 | |
| GSE74703 | PKIB | 5570 | 4 | 1 | 31 | |
| GSE74704 | PKIB | 5570 | 0 | 1 | 19 | |
| TCGA | PKIB | 5570 | 11 | 19 | 66 |
Total number of gains: 44; Total number of losses: 55; Total Number of normals: 389.
Somatic mutations of PKIB:
Generating mutation plots.
Highly correlated genes for PKIB:
Showing top 20/835 corelated genes with mean PCC>0.5.
| Gene1 | Gene2 | Mean PCC | Num. Datasets | Num. PCC<0 | Num. PCC>0.5 |
|---|---|---|---|---|---|
| PKIB | CD1E | 0.722417 | 5 | 0 | 5 |
| PKIB | COMTD1 | 0.705251 | 3 | 0 | 3 |
| PKIB | MNS1 | 0.692813 | 3 | 0 | 3 |
| PKIB | CA13 | 0.692332 | 3 | 0 | 3 |
| PKIB | MBOAT1 | 0.685647 | 3 | 0 | 3 |
| PKIB | VPS52 | 0.681848 | 3 | 0 | 3 |
| PKIB | RNF183 | 0.677347 | 3 | 0 | 3 |
| PKIB | TSTD1 | 0.677256 | 5 | 0 | 4 |
| PKIB | ZBED5 | 0.675332 | 3 | 0 | 3 |
| PKIB | THRAP3 | 0.674938 | 3 | 0 | 3 |
| PKIB | SLC10A5 | 0.674601 | 3 | 0 | 3 |
| PKIB | ARF5 | 0.674454 | 3 | 0 | 3 |
| PKIB | ACTR2 | 0.671907 | 3 | 0 | 3 |
| PKIB | CRYBG3 | 0.671738 | 4 | 0 | 4 |
| PKIB | TMEM219 | 0.671388 | 4 | 0 | 4 |
| PKIB | TSPAN31 | 0.665006 | 3 | 0 | 3 |
| PKIB | GOLGA4 | 0.66251 | 4 | 0 | 4 |
| PKIB | ADH1B | 0.662349 | 5 | 0 | 5 |
| PKIB | C1orf56 | 0.661487 | 3 | 0 | 3 |
| PKIB | NCOR1 | 0.660769 | 4 | 0 | 4 |
For details and further investigation, click here