| Full name: meiosis specific nuclear structural 1 | Alias Symbol: FLJ11222|SPATA40 | ||
| Type: protein-coding gene | Cytoband: 15q21.3 | ||
| Entrez ID: 55329 | HGNC ID: HGNC:29636 | Ensembl Gene: ENSG00000138587 | OMIM ID: 610766 |
Screen Evidence:
| |||
Expression of MNS1:
| Dataset | Gene | EntrezID | Probe | Log2FC | Adj.pValue | Expression |
|---|---|---|---|---|---|---|
| GSE17351 | MNS1 | 55329 | 219703_at | -0.7218 | 0.2807 | |
| GSE20347 | MNS1 | 55329 | 219703_at | -0.0094 | 0.9805 | |
| GSE23400 | MNS1 | 55329 | 219703_at | 0.0584 | 0.2993 | |
| GSE26886 | MNS1 | 55329 | 219703_at | -0.1039 | 0.7637 | |
| GSE29001 | MNS1 | 55329 | 219703_at | 0.0768 | 0.9182 | |
| GSE38129 | MNS1 | 55329 | 219703_at | 0.0065 | 0.9845 | |
| GSE45670 | MNS1 | 55329 | 219703_at | -0.5226 | 0.1135 | |
| GSE63941 | MNS1 | 55329 | 219703_at | 0.5555 | 0.5029 | |
| GSE77861 | MNS1 | 55329 | 219703_at | -0.2437 | 0.0847 | |
| GSE97050 | MNS1 | 55329 | A_23_P3302 | -0.0351 | 0.8705 | |
| SRP064894 | MNS1 | 55329 | RNAseq | -0.8413 | 0.0001 | |
| SRP133303 | MNS1 | 55329 | RNAseq | -0.7043 | 0.0052 | |
| SRP159526 | MNS1 | 55329 | RNAseq | -0.5072 | 0.2140 | |
| SRP193095 | MNS1 | 55329 | RNAseq | -0.5171 | 0.0088 | |
| SRP219564 | MNS1 | 55329 | RNAseq | -0.5135 | 0.0710 | |
| TCGA | MNS1 | 55329 | RNAseq | 0.0404 | 0.8466 |
Upregulated datasets: 0; Downregulated datasets: 0.
Survival by MNS1 expression:
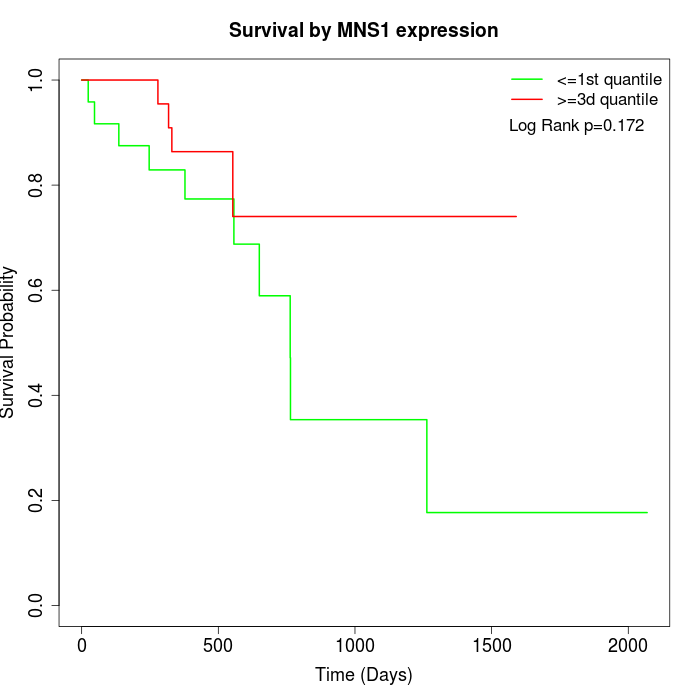 |
| TCGA |
Note: Click image to view full size file.
Copy number change of MNS1:
| Dataset | Gene | EntrezID | Gain | Loss | Normal | Detail |
|---|---|---|---|---|---|---|
| GSE15526 | MNS1 | 55329 | 6 | 3 | 21 | |
| GSE20123 | MNS1 | 55329 | 6 | 3 | 21 | |
| GSE43470 | MNS1 | 55329 | 4 | 4 | 35 | |
| GSE46452 | MNS1 | 55329 | 3 | 7 | 49 | |
| GSE47630 | MNS1 | 55329 | 8 | 10 | 22 | |
| GSE54993 | MNS1 | 55329 | 5 | 6 | 59 | |
| GSE54994 | MNS1 | 55329 | 6 | 8 | 39 | |
| GSE60625 | MNS1 | 55329 | 4 | 0 | 7 | |
| GSE74703 | MNS1 | 55329 | 4 | 3 | 29 | |
| GSE74704 | MNS1 | 55329 | 2 | 3 | 15 | |
| TCGA | MNS1 | 55329 | 10 | 16 | 70 |
Total number of gains: 58; Total number of losses: 63; Total Number of normals: 367.
Somatic mutations of MNS1:
Generating mutation plots.
Highly correlated genes for MNS1:
Showing top 20/300 corelated genes with mean PCC>0.5.
| Gene1 | Gene2 | Mean PCC | Num. Datasets | Num. PCC<0 | Num. PCC>0.5 |
|---|---|---|---|---|---|
| MNS1 | EEA1 | 0.800216 | 3 | 0 | 3 |
| MNS1 | SOCS6 | 0.79512 | 3 | 0 | 3 |
| MNS1 | ZNF823 | 0.784944 | 3 | 0 | 3 |
| MNS1 | RFK | 0.776627 | 3 | 0 | 3 |
| MNS1 | MKLN1 | 0.775512 | 3 | 0 | 3 |
| MNS1 | ASB8 | 0.772201 | 3 | 0 | 3 |
| MNS1 | FBXL3 | 0.769077 | 3 | 0 | 3 |
| MNS1 | HELQ | 0.763078 | 3 | 0 | 3 |
| MNS1 | RALA | 0.762812 | 3 | 0 | 3 |
| MNS1 | NIPSNAP3A | 0.752481 | 3 | 0 | 3 |
| MNS1 | TAB3 | 0.749784 | 3 | 0 | 3 |
| MNS1 | SYPL1 | 0.747206 | 3 | 0 | 3 |
| MNS1 | SPAG16 | 0.739511 | 3 | 0 | 3 |
| MNS1 | MORC3 | 0.734528 | 3 | 0 | 3 |
| MNS1 | STAM2 | 0.734009 | 3 | 0 | 3 |
| MNS1 | USP25 | 0.728372 | 3 | 0 | 3 |
| MNS1 | DLG2 | 0.724669 | 3 | 0 | 3 |
| MNS1 | PANK1 | 0.723069 | 3 | 0 | 3 |
| MNS1 | TRIM13 | 0.721385 | 3 | 0 | 3 |
| MNS1 | PCBD2 | 0.718812 | 3 | 0 | 3 |
For details and further investigation, click here