| Full name: tetraspanin 31 | Alias Symbol: | ||
| Type: protein-coding gene | Cytoband: 12q14.1 | ||
| Entrez ID: 6302 | HGNC ID: HGNC:10539 | Ensembl Gene: ENSG00000135452 | OMIM ID: 181035 |
Screen Evidence:
| |||
Expression of TSPAN31:
| Dataset | Gene | EntrezID | Probe | Log2FC | Adj.pValue | Expression |
|---|---|---|---|---|---|---|
| GSE17351 | TSPAN31 | 6302 | 203227_s_at | -0.6358 | 0.0557 | |
| GSE20347 | TSPAN31 | 6302 | 203227_s_at | -0.1338 | 0.5157 | |
| GSE23400 | TSPAN31 | 6302 | 203226_s_at | -0.0630 | 0.2094 | |
| GSE26886 | TSPAN31 | 6302 | 203227_s_at | 0.6156 | 0.0228 | |
| GSE29001 | TSPAN31 | 6302 | 203227_s_at | -0.3936 | 0.0318 | |
| GSE38129 | TSPAN31 | 6302 | 203227_s_at | -0.1447 | 0.4183 | |
| GSE45670 | TSPAN31 | 6302 | 203227_s_at | -0.0415 | 0.8073 | |
| GSE53622 | TSPAN31 | 6302 | 20158 | -0.0853 | 0.1716 | |
| GSE53624 | TSPAN31 | 6302 | 20158 | -0.1540 | 0.1238 | |
| GSE63941 | TSPAN31 | 6302 | 203227_s_at | -0.4137 | 0.4933 | |
| GSE77861 | TSPAN31 | 6302 | 203227_s_at | -0.2959 | 0.2829 | |
| GSE97050 | TSPAN31 | 6302 | A_23_P24987 | 0.2737 | 0.2423 | |
| SRP007169 | TSPAN31 | 6302 | RNAseq | -0.1031 | 0.7894 | |
| SRP008496 | TSPAN31 | 6302 | RNAseq | -0.1067 | 0.7463 | |
| SRP064894 | TSPAN31 | 6302 | RNAseq | -0.1565 | 0.2762 | |
| SRP133303 | TSPAN31 | 6302 | RNAseq | 0.0079 | 0.9530 | |
| SRP159526 | TSPAN31 | 6302 | RNAseq | -0.1658 | 0.3738 | |
| SRP193095 | TSPAN31 | 6302 | RNAseq | -0.0819 | 0.5472 | |
| SRP219564 | TSPAN31 | 6302 | RNAseq | -0.0729 | 0.6884 | |
| TCGA | TSPAN31 | 6302 | RNAseq | -0.1415 | 0.0057 |
Upregulated datasets: 0; Downregulated datasets: 0.
Survival by TSPAN31 expression:
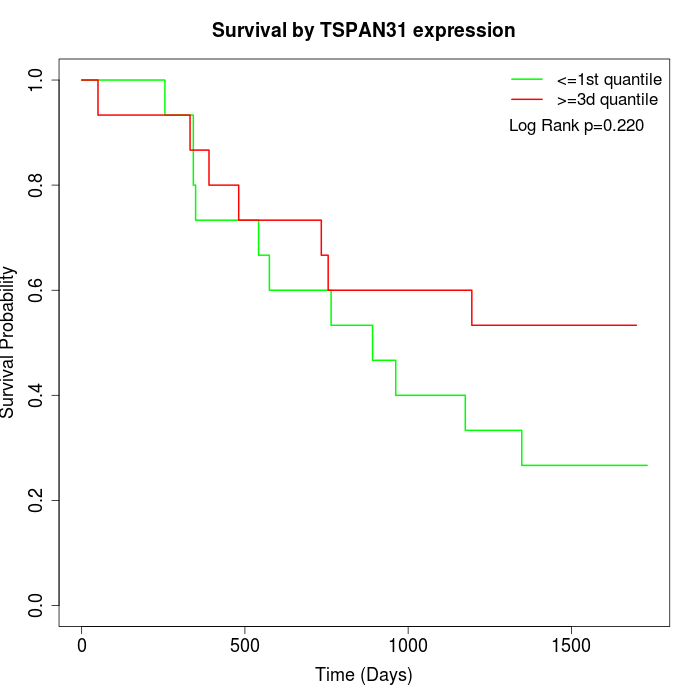 | 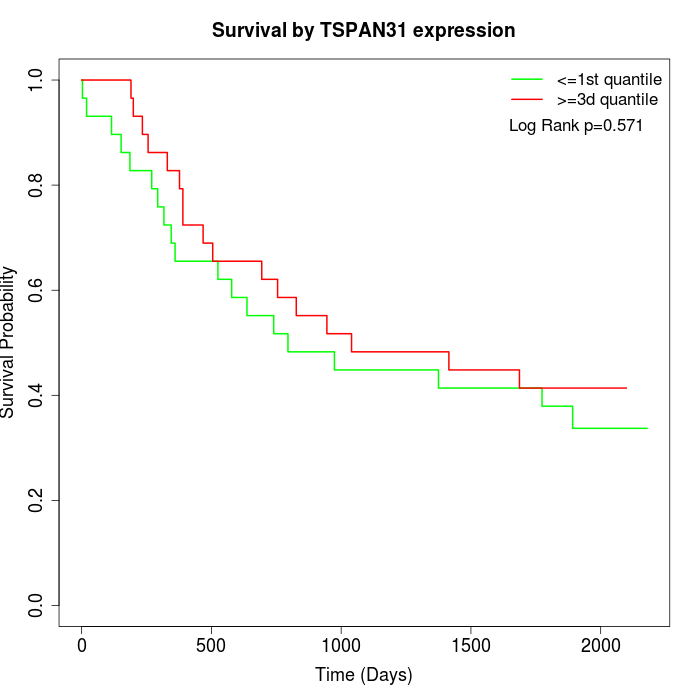 | 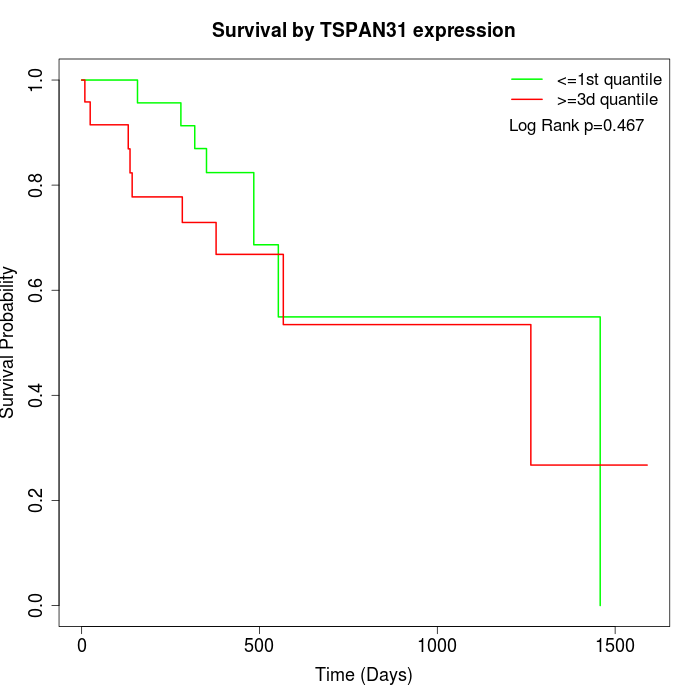 |
| GSE53622 | GSE53624 | TCGA |
Note: Click image to view full size file.
Copy number change of TSPAN31:
| Dataset | Gene | EntrezID | Gain | Loss | Normal | Detail |
|---|---|---|---|---|---|---|
| GSE15526 | TSPAN31 | 6302 | 7 | 1 | 22 | |
| GSE20123 | TSPAN31 | 6302 | 7 | 0 | 23 | |
| GSE43470 | TSPAN31 | 6302 | 2 | 0 | 41 | |
| GSE46452 | TSPAN31 | 6302 | 8 | 1 | 50 | |
| GSE47630 | TSPAN31 | 6302 | 10 | 2 | 28 | |
| GSE54993 | TSPAN31 | 6302 | 0 | 5 | 65 | |
| GSE54994 | TSPAN31 | 6302 | 4 | 1 | 48 | |
| GSE60625 | TSPAN31 | 6302 | 0 | 0 | 11 | |
| GSE74703 | TSPAN31 | 6302 | 2 | 0 | 34 | |
| GSE74704 | TSPAN31 | 6302 | 5 | 0 | 15 | |
| TCGA | TSPAN31 | 6302 | 14 | 10 | 72 |
Total number of gains: 59; Total number of losses: 20; Total Number of normals: 409.
Somatic mutations of TSPAN31:
Generating mutation plots.
Highly correlated genes for TSPAN31:
Showing top 20/299 corelated genes with mean PCC>0.5.
| Gene1 | Gene2 | Mean PCC | Num. Datasets | Num. PCC<0 | Num. PCC>0.5 |
|---|---|---|---|---|---|
| TSPAN31 | CRYBG3 | 0.790004 | 3 | 0 | 3 |
| TSPAN31 | MTIF3 | 0.775501 | 3 | 0 | 3 |
| TSPAN31 | ELL3 | 0.76341 | 4 | 0 | 4 |
| TSPAN31 | FAM8A1 | 0.757529 | 3 | 0 | 3 |
| TSPAN31 | BIVM | 0.757391 | 3 | 0 | 3 |
| TSPAN31 | RNF125 | 0.752437 | 3 | 0 | 3 |
| TSPAN31 | TRIM13 | 0.747832 | 3 | 0 | 3 |
| TSPAN31 | CLYBL | 0.747555 | 3 | 0 | 3 |
| TSPAN31 | POLR2I | 0.745522 | 3 | 0 | 3 |
| TSPAN31 | APIP | 0.742771 | 3 | 0 | 3 |
| TSPAN31 | GALM | 0.739815 | 3 | 0 | 3 |
| TSPAN31 | ARMCX5 | 0.737526 | 3 | 0 | 3 |
| TSPAN31 | FIG4 | 0.736139 | 4 | 0 | 4 |
| TSPAN31 | PIK3C2A | 0.721989 | 3 | 0 | 3 |
| TSPAN31 | RBM4 | 0.720395 | 4 | 0 | 4 |
| TSPAN31 | GAPVD1 | 0.718632 | 3 | 0 | 3 |
| TSPAN31 | CLOCK | 0.717781 | 4 | 0 | 4 |
| TSPAN31 | C5 | 0.714489 | 3 | 0 | 3 |
| TSPAN31 | PDE6D | 0.711205 | 3 | 0 | 3 |
| TSPAN31 | IMMP1L | 0.709791 | 3 | 0 | 3 |
For details and further investigation, click here