| Full name: phospholipase B1 | Alias Symbol: PLB|FLJ30866 | ||
| Type: protein-coding gene | Cytoband: 2p23.2 | ||
| Entrez ID: 151056 | HGNC ID: HGNC:30041 | Ensembl Gene: ENSG00000163803 | OMIM ID: 610179 |
Expression of PLB1:
| Dataset | Gene | EntrezID | Probe | Log2FC | Adj.pValue | Expression |
|---|---|---|---|---|---|---|
| GSE17351 | PLB1 | 151056 | 235703_at | -0.0466 | 0.8546 | |
| GSE26886 | PLB1 | 151056 | 235703_at | 0.0756 | 0.5864 | |
| GSE45670 | PLB1 | 151056 | 235703_at | 0.0994 | 0.2244 | |
| GSE53622 | PLB1 | 151056 | 135599 | 0.4439 | 0.0009 | |
| GSE53624 | PLB1 | 151056 | 109749 | -0.6095 | 0.0000 | |
| GSE63941 | PLB1 | 151056 | 235703_at | -0.0483 | 0.7411 | |
| GSE77861 | PLB1 | 151056 | 235703_at | -0.0573 | 0.5823 | |
| GSE97050 | PLB1 | 151056 | A_33_P3381621 | 0.0184 | 0.9486 | |
| SRP007169 | PLB1 | 151056 | RNAseq | -0.9612 | 0.0731 | |
| SRP064894 | PLB1 | 151056 | RNAseq | 0.2087 | 0.4095 | |
| SRP133303 | PLB1 | 151056 | RNAseq | -0.0233 | 0.9198 | |
| SRP159526 | PLB1 | 151056 | RNAseq | -0.8096 | 0.0639 | |
| SRP193095 | PLB1 | 151056 | RNAseq | 0.4852 | 0.0362 | |
| SRP219564 | PLB1 | 151056 | RNAseq | 0.7563 | 0.1764 | |
| TCGA | PLB1 | 151056 | RNAseq | 0.5092 | 0.0049 |
Upregulated datasets: 0; Downregulated datasets: 0.
Survival by PLB1 expression:
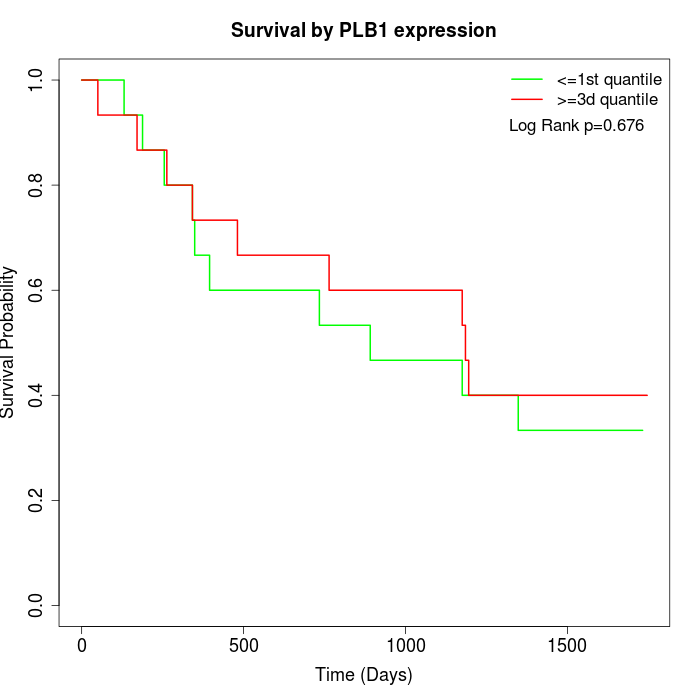 |  | 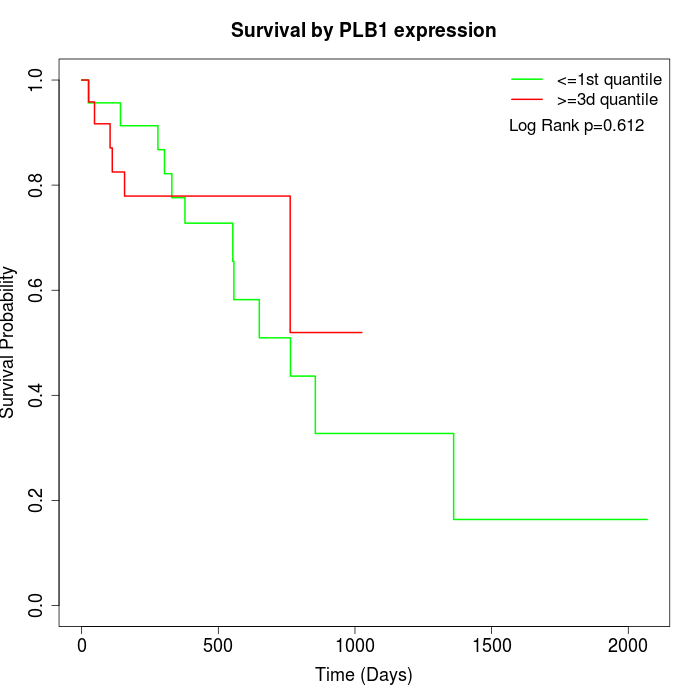 |
| GSE53622 | GSE53624 | TCGA |
Note: Click image to view full size file.
Copy number change of PLB1:
| Dataset | Gene | EntrezID | Gain | Loss | Normal | Detail |
|---|---|---|---|---|---|---|
| GSE15526 | PLB1 | 151056 | 11 | 2 | 17 | |
| GSE20123 | PLB1 | 151056 | 11 | 2 | 17 | |
| GSE43470 | PLB1 | 151056 | 3 | 1 | 39 | |
| GSE46452 | PLB1 | 151056 | 2 | 4 | 53 | |
| GSE47630 | PLB1 | 151056 | 8 | 0 | 32 | |
| GSE54993 | PLB1 | 151056 | 0 | 6 | 64 | |
| GSE54994 | PLB1 | 151056 | 10 | 0 | 43 | |
| GSE60625 | PLB1 | 151056 | 0 | 3 | 8 | |
| GSE74703 | PLB1 | 151056 | 3 | 0 | 33 | |
| GSE74704 | PLB1 | 151056 | 9 | 1 | 10 | |
| TCGA | PLB1 | 151056 | 36 | 2 | 58 |
Total number of gains: 93; Total number of losses: 21; Total Number of normals: 374.
Somatic mutations of PLB1:
Generating mutation plots.
Highly correlated genes for PLB1:
Showing top 20/50 corelated genes with mean PCC>0.5.
| Gene1 | Gene2 | Mean PCC | Num. Datasets | Num. PCC<0 | Num. PCC>0.5 |
|---|---|---|---|---|---|
| PLB1 | OR1F1 | 0.794434 | 3 | 0 | 3 |
| PLB1 | NXPH3 | 0.769373 | 3 | 0 | 3 |
| PLB1 | C22orf39 | 0.716283 | 3 | 0 | 3 |
| PLB1 | MAGEL2 | 0.714621 | 3 | 0 | 3 |
| PLB1 | MAG | 0.713875 | 3 | 0 | 3 |
| PLB1 | CTNNA2 | 0.713162 | 3 | 0 | 3 |
| PLB1 | DOK7 | 0.712957 | 3 | 0 | 3 |
| PLB1 | FBXL15 | 0.70799 | 3 | 0 | 3 |
| PLB1 | NCR3 | 0.690387 | 3 | 0 | 3 |
| PLB1 | IL17B | 0.685911 | 3 | 0 | 3 |
| PLB1 | NKAIN4 | 0.682741 | 3 | 0 | 3 |
| PLB1 | NRIP2 | 0.669989 | 3 | 0 | 3 |
| PLB1 | PRODH2 | 0.666117 | 3 | 0 | 3 |
| PLB1 | CACNG8 | 0.661858 | 3 | 0 | 3 |
| PLB1 | CNTN4 | 0.660322 | 3 | 0 | 3 |
| PLB1 | CDH4 | 0.658204 | 3 | 0 | 3 |
| PLB1 | FERD3L | 0.654061 | 3 | 0 | 3 |
| PLB1 | ACSM2B | 0.651395 | 4 | 0 | 3 |
| PLB1 | ANKRD53 | 0.649575 | 3 | 0 | 3 |
| PLB1 | CLDN14 | 0.644934 | 4 | 0 | 3 |
For details and further investigation, click here