| Full name: transforming growth factor beta 1 induced transcript 1 | Alias Symbol: Hic-5|TSC-5|ARA55|HIC-5 | ||
| Type: protein-coding gene | Cytoband: 16p11.2 | ||
| Entrez ID: 7041 | HGNC ID: HGNC:11767 | Ensembl Gene: ENSG00000140682 | OMIM ID: 602353 |
Expression of TGFB1I1:
| Dataset | Gene | EntrezID | Probe | Log2FC | Adj.pValue | Expression |
|---|---|---|---|---|---|---|
| GSE17351 | TGFB1I1 | 7041 | 209651_at | -1.2564 | 0.2008 | |
| GSE20347 | TGFB1I1 | 7041 | 209651_at | 0.3060 | 0.4951 | |
| GSE23400 | TGFB1I1 | 7041 | 209651_at | -0.3505 | 0.0558 | |
| GSE26886 | TGFB1I1 | 7041 | 209651_at | 3.1820 | 0.0000 | |
| GSE29001 | TGFB1I1 | 7041 | 209651_at | 0.2729 | 0.6567 | |
| GSE38129 | TGFB1I1 | 7041 | 209651_at | -0.3177 | 0.5697 | |
| GSE45670 | TGFB1I1 | 7041 | 209651_at | -2.1098 | 0.0000 | |
| GSE53622 | TGFB1I1 | 7041 | 3460 | -0.3081 | 0.0346 | |
| GSE53624 | TGFB1I1 | 7041 | 9967 | -0.0313 | 0.7575 | |
| GSE63941 | TGFB1I1 | 7041 | 209651_at | -4.0695 | 0.0133 | |
| GSE77861 | TGFB1I1 | 7041 | 209651_at | 1.2288 | 0.0904 | |
| GSE97050 | TGFB1I1 | 7041 | A_33_P3236858 | -0.7259 | 0.1726 | |
| SRP007169 | TGFB1I1 | 7041 | RNAseq | 3.4812 | 0.0000 | |
| SRP008496 | TGFB1I1 | 7041 | RNAseq | 3.6330 | 0.0000 | |
| SRP064894 | TGFB1I1 | 7041 | RNAseq | 0.1952 | 0.5923 | |
| SRP133303 | TGFB1I1 | 7041 | RNAseq | -0.1857 | 0.6258 | |
| SRP159526 | TGFB1I1 | 7041 | RNAseq | -0.6422 | 0.1109 | |
| SRP193095 | TGFB1I1 | 7041 | RNAseq | 1.3313 | 0.0000 | |
| SRP219564 | TGFB1I1 | 7041 | RNAseq | -0.7127 | 0.4189 | |
| TCGA | TGFB1I1 | 7041 | RNAseq | -0.2398 | 0.0258 |
Upregulated datasets: 4; Downregulated datasets: 2.
Survival by TGFB1I1 expression:
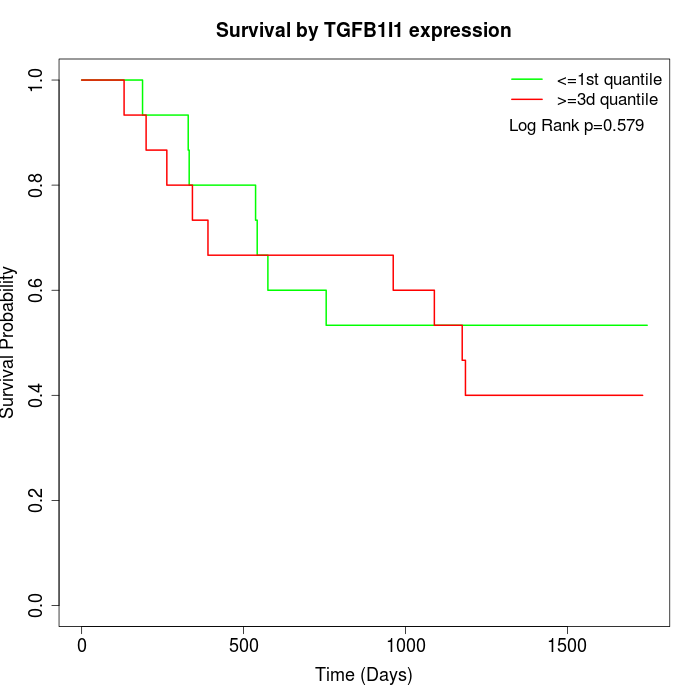 | 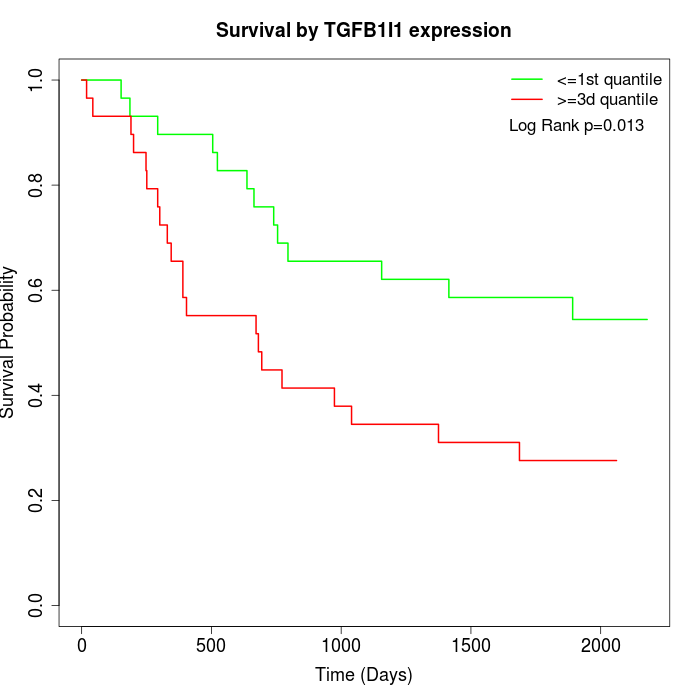 | 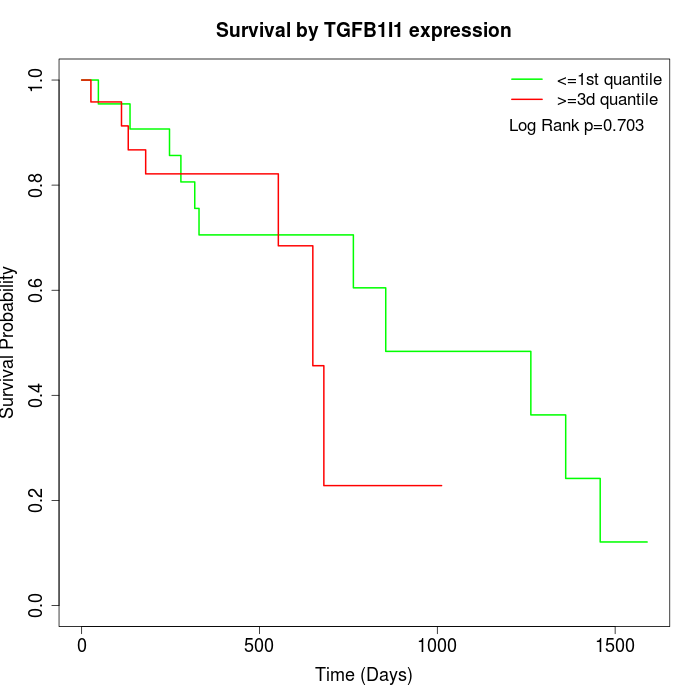 |
| GSE53622 | GSE53624 | TCGA |
Note: Click image to view full size file.
Copy number change of TGFB1I1:
| Dataset | Gene | EntrezID | Gain | Loss | Normal | Detail |
|---|---|---|---|---|---|---|
| GSE15526 | TGFB1I1 | 7041 | 4 | 4 | 22 | |
| GSE20123 | TGFB1I1 | 7041 | 3 | 3 | 24 | |
| GSE43470 | TGFB1I1 | 7041 | 3 | 3 | 37 | |
| GSE46452 | TGFB1I1 | 7041 | 38 | 1 | 20 | |
| GSE47630 | TGFB1I1 | 7041 | 11 | 7 | 22 | |
| GSE54993 | TGFB1I1 | 7041 | 2 | 5 | 63 | |
| GSE54994 | TGFB1I1 | 7041 | 4 | 10 | 39 | |
| GSE60625 | TGFB1I1 | 7041 | 4 | 0 | 7 | |
| GSE74703 | TGFB1I1 | 7041 | 3 | 2 | 31 | |
| GSE74704 | TGFB1I1 | 7041 | 3 | 2 | 15 | |
| TCGA | TGFB1I1 | 7041 | 20 | 10 | 66 |
Total number of gains: 95; Total number of losses: 47; Total Number of normals: 346.
Somatic mutations of TGFB1I1:
Generating mutation plots.
Highly correlated genes for TGFB1I1:
Showing top 20/1209 corelated genes with mean PCC>0.5.
| Gene1 | Gene2 | Mean PCC | Num. Datasets | Num. PCC<0 | Num. PCC>0.5 |
|---|---|---|---|---|---|
| TGFB1I1 | ZEB1 | 0.862808 | 3 | 0 | 3 |
| TGFB1I1 | FERMT2 | 0.84087 | 12 | 0 | 12 |
| TGFB1I1 | SYNC | 0.812266 | 7 | 0 | 7 |
| TGFB1I1 | TPM2 | 0.802552 | 12 | 0 | 12 |
| TGFB1I1 | C11orf96 | 0.800894 | 5 | 0 | 5 |
| TGFB1I1 | PKIG | 0.78858 | 11 | 0 | 11 |
| TGFB1I1 | TPM1 | 0.785757 | 12 | 0 | 12 |
| TGFB1I1 | CALD1 | 0.783925 | 13 | 0 | 12 |
| TGFB1I1 | INPP5E | 0.782453 | 3 | 0 | 3 |
| TGFB1I1 | SMTN | 0.778922 | 11 | 0 | 11 |
| TGFB1I1 | FILIP1L | 0.77366 | 12 | 0 | 12 |
| TGFB1I1 | ANTXR2 | 0.773486 | 8 | 0 | 8 |
| TGFB1I1 | TMEM47 | 0.773381 | 12 | 0 | 12 |
| TGFB1I1 | FLNA | 0.771635 | 11 | 0 | 11 |
| TGFB1I1 | ZNF771 | 0.771414 | 3 | 0 | 3 |
| TGFB1I1 | FIBIN | 0.769384 | 5 | 0 | 4 |
| TGFB1I1 | JAM3 | 0.769061 | 13 | 0 | 12 |
| TGFB1I1 | PDLIM3 | 0.762122 | 12 | 0 | 12 |
| TGFB1I1 | BVES | 0.761883 | 8 | 0 | 8 |
| TGFB1I1 | DACT3 | 0.761239 | 7 | 0 | 7 |
For details and further investigation, click here