| Full name: phospholipid transfer protein | Alias Symbol: BPIFE | ||
| Type: protein-coding gene | Cytoband: 20q13.12 | ||
| Entrez ID: 5360 | HGNC ID: HGNC:9093 | Ensembl Gene: ENSG00000100979 | OMIM ID: 172425 |
| Related drugs: SIMVASTATIN, VITAMIN E... [more] | |||
PLTP involved pathways:
| KEGG pathway | Description | View |
|---|---|---|
| hsa03320 | PPAR signaling pathway |
Expression of PLTP:
| Dataset | Gene | EntrezID | Probe | Log2FC | Adj.pValue | Expression |
|---|---|---|---|---|---|---|
| GSE17351 | PLTP | 5360 | 202075_s_at | 0.4889 | 0.5413 | |
| GSE20347 | PLTP | 5360 | 202075_s_at | 1.3849 | 0.0010 | |
| GSE23400 | PLTP | 5360 | 202075_s_at | 0.7327 | 0.0000 | |
| GSE26886 | PLTP | 5360 | 202075_s_at | 1.5067 | 0.0000 | |
| GSE29001 | PLTP | 5360 | 202075_s_at | 1.0145 | 0.0310 | |
| GSE38129 | PLTP | 5360 | 202075_s_at | 0.9355 | 0.0042 | |
| GSE45670 | PLTP | 5360 | 202075_s_at | 0.1424 | 0.7705 | |
| GSE53622 | PLTP | 5360 | 60243 | 0.3706 | 0.0161 | |
| GSE53624 | PLTP | 5360 | 60243 | 0.8339 | 0.0000 | |
| GSE63941 | PLTP | 5360 | 202075_s_at | 0.6736 | 0.6718 | |
| GSE77861 | PLTP | 5360 | 202075_s_at | 1.4147 | 0.0058 | |
| GSE97050 | PLTP | 5360 | A_23_P5983 | 0.7583 | 0.2385 | |
| SRP007169 | PLTP | 5360 | RNAseq | 2.4815 | 0.0000 | |
| SRP008496 | PLTP | 5360 | RNAseq | 2.7690 | 0.0000 | |
| SRP064894 | PLTP | 5360 | RNAseq | 1.3122 | 0.0011 | |
| SRP133303 | PLTP | 5360 | RNAseq | 0.3213 | 0.4330 | |
| SRP159526 | PLTP | 5360 | RNAseq | 0.6276 | 0.1605 | |
| SRP193095 | PLTP | 5360 | RNAseq | 1.6433 | 0.0000 | |
| SRP219564 | PLTP | 5360 | RNAseq | 1.1104 | 0.1933 | |
| TCGA | PLTP | 5360 | RNAseq | -0.0777 | 0.4708 |
Upregulated datasets: 8; Downregulated datasets: 0.
Survival by PLTP expression:
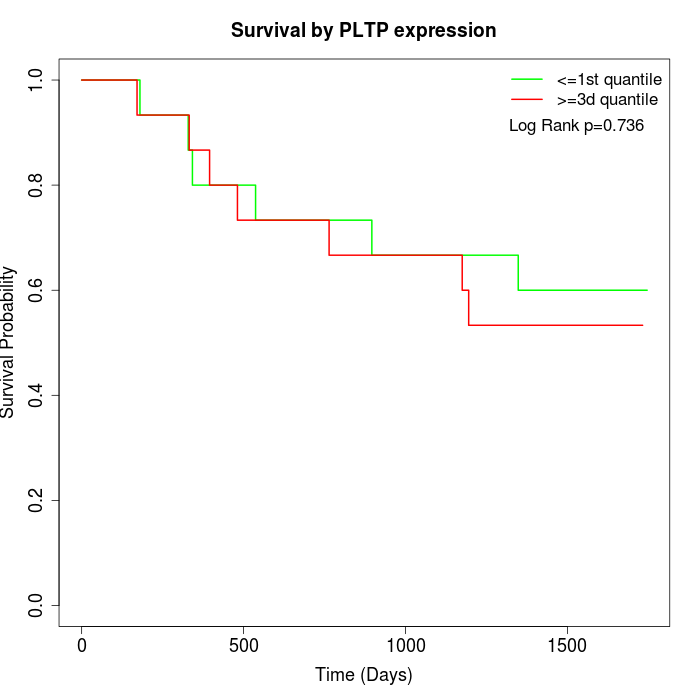 | 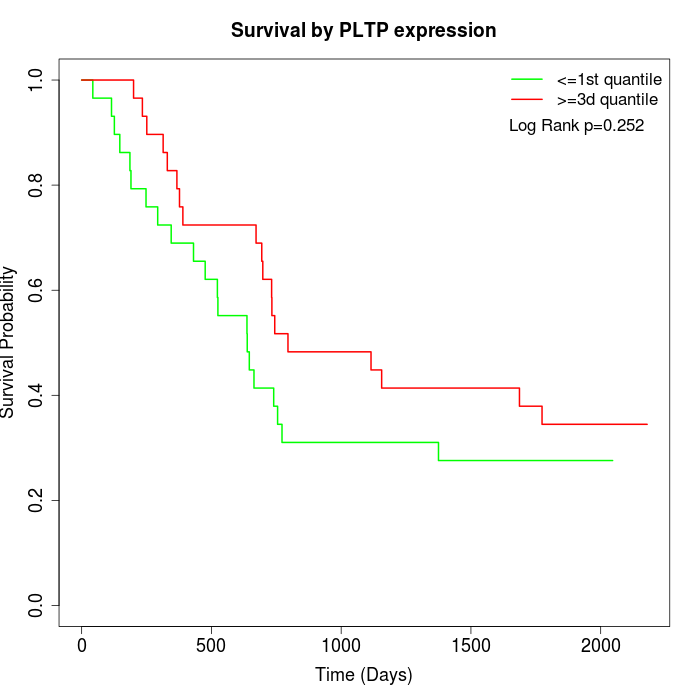 | 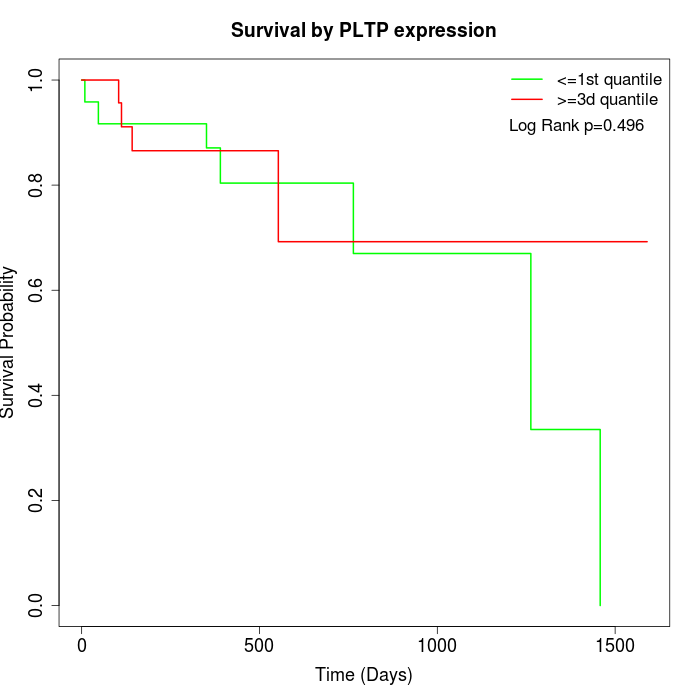 |
| GSE53622 | GSE53624 | TCGA |
Note: Click image to view full size file.
Copy number change of PLTP:
| Dataset | Gene | EntrezID | Gain | Loss | Normal | Detail |
|---|---|---|---|---|---|---|
| GSE15526 | PLTP | 5360 | 14 | 1 | 15 | |
| GSE20123 | PLTP | 5360 | 14 | 1 | 15 | |
| GSE43470 | PLTP | 5360 | 12 | 1 | 30 | |
| GSE46452 | PLTP | 5360 | 29 | 0 | 30 | |
| GSE47630 | PLTP | 5360 | 24 | 1 | 15 | |
| GSE54993 | PLTP | 5360 | 0 | 17 | 53 | |
| GSE54994 | PLTP | 5360 | 25 | 0 | 28 | |
| GSE60625 | PLTP | 5360 | 0 | 0 | 11 | |
| GSE74703 | PLTP | 5360 | 10 | 1 | 25 | |
| GSE74704 | PLTP | 5360 | 10 | 0 | 10 | |
| TCGA | PLTP | 5360 | 46 | 3 | 47 |
Total number of gains: 184; Total number of losses: 25; Total Number of normals: 279.
Somatic mutations of PLTP:
Generating mutation plots.
Highly correlated genes for PLTP:
Showing top 20/1074 corelated genes with mean PCC>0.5.
| Gene1 | Gene2 | Mean PCC | Num. Datasets | Num. PCC<0 | Num. PCC>0.5 |
|---|---|---|---|---|---|
| PLTP | CRTC2 | 0.792078 | 3 | 0 | 3 |
| PLTP | SCYL1 | 0.756963 | 4 | 0 | 4 |
| PLTP | RAVER1 | 0.737246 | 3 | 0 | 3 |
| PLTP | SSBP4 | 0.718991 | 3 | 0 | 3 |
| PLTP | PSPC1 | 0.71729 | 4 | 0 | 4 |
| PLTP | ABCB6 | 0.712383 | 3 | 0 | 3 |
| PLTP | ZC3H3 | 0.710776 | 3 | 0 | 3 |
| PLTP | RNF26 | 0.70648 | 4 | 0 | 4 |
| PLTP | FAM169A | 0.697239 | 4 | 0 | 4 |
| PLTP | OCIAD2 | 0.69644 | 3 | 0 | 3 |
| PLTP | AUP1 | 0.695547 | 4 | 0 | 4 |
| PLTP | RELA | 0.693018 | 3 | 0 | 3 |
| PLTP | DMRT2 | 0.691161 | 3 | 0 | 3 |
| PLTP | RILPL1 | 0.689989 | 3 | 0 | 3 |
| PLTP | ZIC2 | 0.684582 | 3 | 0 | 3 |
| PLTP | AGAP2-AS1 | 0.682234 | 3 | 0 | 3 |
| PLTP | HNRNPF | 0.681205 | 3 | 0 | 3 |
| PLTP | MBD3 | 0.680292 | 3 | 0 | 3 |
| PLTP | ZNF703 | 0.678448 | 3 | 0 | 3 |
| PLTP | ZNF488 | 0.677437 | 3 | 0 | 3 |
For details and further investigation, click here