| Full name: peptidylprolyl isomerase E | Alias Symbol: CyP-33|MGC3736|MGC111222 | ||
| Type: protein-coding gene | Cytoband: 1p34.2 | ||
| Entrez ID: 10450 | HGNC ID: HGNC:9258 | Ensembl Gene: ENSG00000084072 | OMIM ID: 602435 |
Screen Evidence:
| |||
Expression of PPIE:
| Dataset | Gene | EntrezID | Probe | Log2FC | Adj.pValue | Expression |
|---|---|---|---|---|---|---|
| GSE17351 | PPIE | 10450 | 210502_s_at | 0.2246 | 0.7096 | |
| GSE20347 | PPIE | 10450 | 210502_s_at | 0.3416 | 0.0492 | |
| GSE23400 | PPIE | 10450 | 210502_s_at | 0.2264 | 0.0003 | |
| GSE26886 | PPIE | 10450 | 202494_at | 0.1713 | 0.1820 | |
| GSE29001 | PPIE | 10450 | 202494_at | 0.4002 | 0.0663 | |
| GSE38129 | PPIE | 10450 | 210502_s_at | 0.2841 | 0.0471 | |
| GSE45670 | PPIE | 10450 | 210502_s_at | -0.0522 | 0.7433 | |
| GSE53622 | PPIE | 10450 | 163863 | 0.1561 | 0.0403 | |
| GSE53624 | PPIE | 10450 | 126021 | 0.6711 | 0.0000 | |
| GSE63941 | PPIE | 10450 | 210502_s_at | 1.2110 | 0.0094 | |
| GSE77861 | PPIE | 10450 | 210502_s_at | 0.2781 | 0.2092 | |
| GSE97050 | PPIE | 10450 | A_23_P74526 | -0.0723 | 0.7694 | |
| SRP007169 | PPIE | 10450 | RNAseq | 0.5254 | 0.3261 | |
| SRP008496 | PPIE | 10450 | RNAseq | 0.9986 | 0.0115 | |
| SRP064894 | PPIE | 10450 | RNAseq | 0.0723 | 0.7462 | |
| SRP133303 | PPIE | 10450 | RNAseq | 0.2611 | 0.0892 | |
| SRP159526 | PPIE | 10450 | RNAseq | 1.3725 | 0.0493 | |
| SRP193095 | PPIE | 10450 | RNAseq | 0.2082 | 0.0437 | |
| SRP219564 | PPIE | 10450 | RNAseq | 0.0809 | 0.8572 | |
| TCGA | PPIE | 10450 | RNAseq | 0.1246 | 0.0633 |
Upregulated datasets: 2; Downregulated datasets: 0.
Survival by PPIE expression:
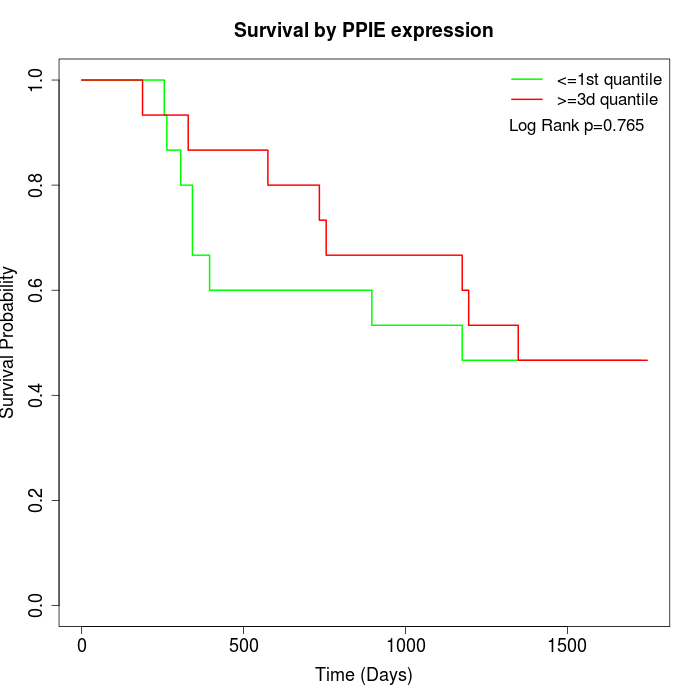 | 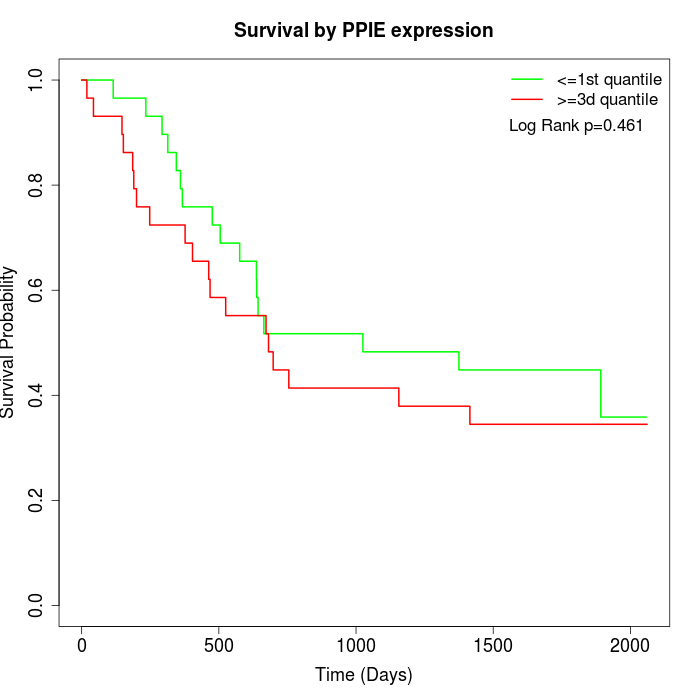 | 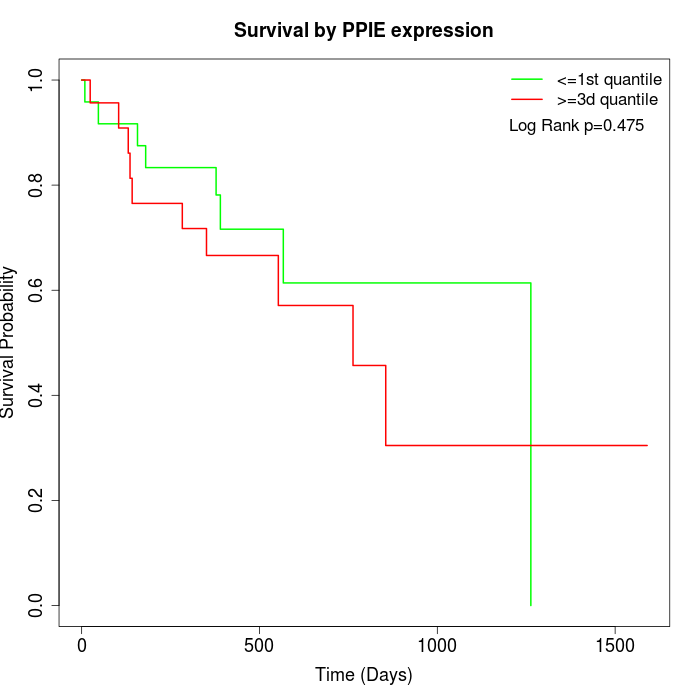 |
| GSE53622 | GSE53624 | TCGA |
Note: Click image to view full size file.
Copy number change of PPIE:
| Dataset | Gene | EntrezID | Gain | Loss | Normal | Detail |
|---|---|---|---|---|---|---|
| GSE15526 | PPIE | 10450 | 3 | 4 | 23 | |
| GSE20123 | PPIE | 10450 | 2 | 3 | 25 | |
| GSE43470 | PPIE | 10450 | 8 | 2 | 33 | |
| GSE46452 | PPIE | 10450 | 4 | 1 | 54 | |
| GSE47630 | PPIE | 10450 | 9 | 2 | 29 | |
| GSE54993 | PPIE | 10450 | 0 | 1 | 69 | |
| GSE54994 | PPIE | 10450 | 13 | 2 | 38 | |
| GSE60625 | PPIE | 10450 | 0 | 0 | 11 | |
| GSE74703 | PPIE | 10450 | 7 | 1 | 28 | |
| GSE74704 | PPIE | 10450 | 1 | 0 | 19 | |
| TCGA | PPIE | 10450 | 16 | 16 | 64 |
Total number of gains: 63; Total number of losses: 32; Total Number of normals: 393.
Somatic mutations of PPIE:
Generating mutation plots.
Highly correlated genes for PPIE:
Showing top 20/823 corelated genes with mean PCC>0.5.
| Gene1 | Gene2 | Mean PCC | Num. Datasets | Num. PCC<0 | Num. PCC>0.5 |
|---|---|---|---|---|---|
| PPIE | USP37 | 0.774203 | 3 | 0 | 3 |
| PPIE | KRR1 | 0.773822 | 3 | 0 | 3 |
| PPIE | IST1 | 0.7584 | 3 | 0 | 3 |
| PPIE | PA2G4 | 0.743461 | 3 | 0 | 3 |
| PPIE | NAA30 | 0.738815 | 3 | 0 | 3 |
| PPIE | BOD1 | 0.726903 | 4 | 0 | 3 |
| PPIE | RPS14 | 0.722172 | 3 | 0 | 3 |
| PPIE | ZNF664 | 0.712237 | 5 | 0 | 4 |
| PPIE | COX6C | 0.706367 | 3 | 0 | 3 |
| PPIE | PITPNB | 0.706055 | 3 | 0 | 3 |
| PPIE | AGAP1 | 0.705564 | 5 | 0 | 5 |
| PPIE | TRIP6 | 0.703747 | 3 | 0 | 3 |
| PPIE | CAMTA1 | 0.701442 | 4 | 0 | 4 |
| PPIE | AKAP8 | 0.700599 | 4 | 0 | 4 |
| PPIE | SFPQ | 0.696544 | 4 | 0 | 3 |
| PPIE | TSNARE1 | 0.69554 | 3 | 0 | 3 |
| PPIE | EPPK1 | 0.691261 | 3 | 0 | 3 |
| PPIE | TRPC4AP | 0.690387 | 3 | 0 | 3 |
| PPIE | ERP29 | 0.689502 | 4 | 0 | 4 |
| PPIE | PELI2 | 0.684514 | 4 | 0 | 3 |
For details and further investigation, click here