| Full name: peptidylprolyl isomerase like 1 | Alias Symbol: CYPL1 | ||
| Type: protein-coding gene | Cytoband: 6p21.2 | ||
| Entrez ID: 51645 | HGNC ID: HGNC:9260 | Ensembl Gene: ENSG00000137168 | OMIM ID: 601301 |
Screen Evidence:
| |||
Expression of PPIL1:
| Dataset | Gene | EntrezID | Probe | Log2FC | Adj.pValue | Expression |
|---|---|---|---|---|---|---|
| GSE17351 | PPIL1 | 51645 | 222500_at | 0.6021 | 0.2966 | |
| GSE26886 | PPIL1 | 51645 | 222500_at | 0.7448 | 0.0089 | |
| GSE45670 | PPIL1 | 51645 | 222500_at | 0.8159 | 0.0000 | |
| GSE53622 | PPIL1 | 51645 | 76225 | 0.5751 | 0.0000 | |
| GSE53624 | PPIL1 | 51645 | 76225 | 0.8240 | 0.0000 | |
| GSE63941 | PPIL1 | 51645 | 222500_at | 0.5318 | 0.2467 | |
| GSE77861 | PPIL1 | 51645 | 222500_at | 0.2918 | 0.5372 | |
| GSE97050 | PPIL1 | 51645 | A_23_P133995 | 0.5371 | 0.1952 | |
| SRP007169 | PPIL1 | 51645 | RNAseq | 0.8838 | 0.0126 | |
| SRP008496 | PPIL1 | 51645 | RNAseq | 0.9990 | 0.0001 | |
| SRP064894 | PPIL1 | 51645 | RNAseq | 0.7540 | 0.0009 | |
| SRP133303 | PPIL1 | 51645 | RNAseq | 0.9171 | 0.0000 | |
| SRP159526 | PPIL1 | 51645 | RNAseq | 0.6046 | 0.0077 | |
| SRP193095 | PPIL1 | 51645 | RNAseq | 0.3093 | 0.0281 | |
| SRP219564 | PPIL1 | 51645 | RNAseq | 0.6177 | 0.0673 | |
| TCGA | PPIL1 | 51645 | RNAseq | 0.2841 | 0.0000 |
Upregulated datasets: 0; Downregulated datasets: 0.
Survival by PPIL1 expression:
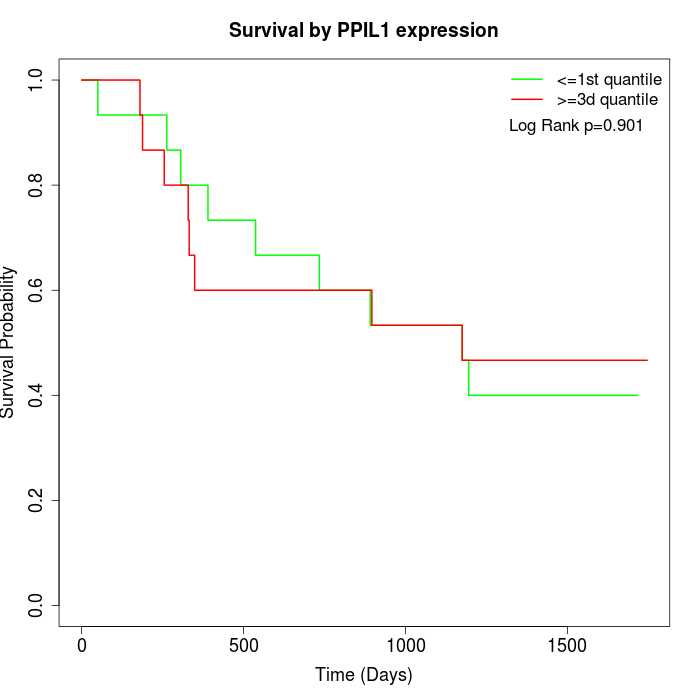 | 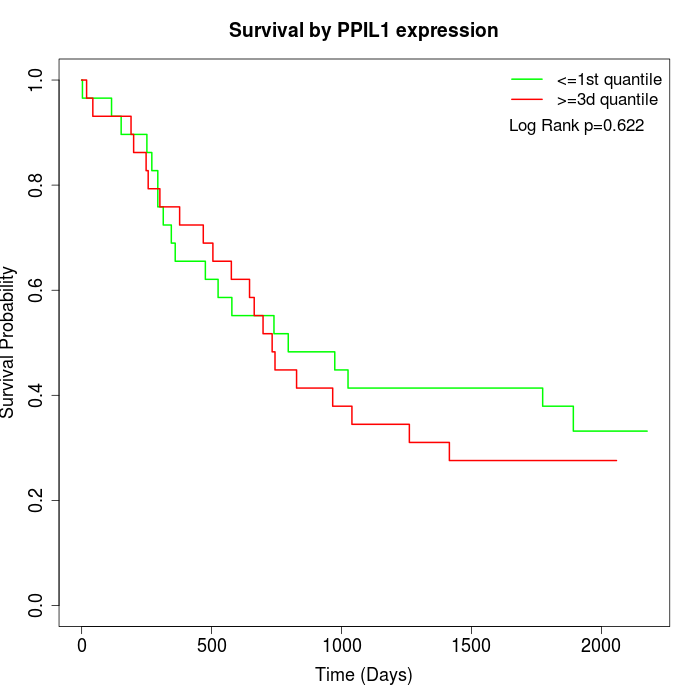 | 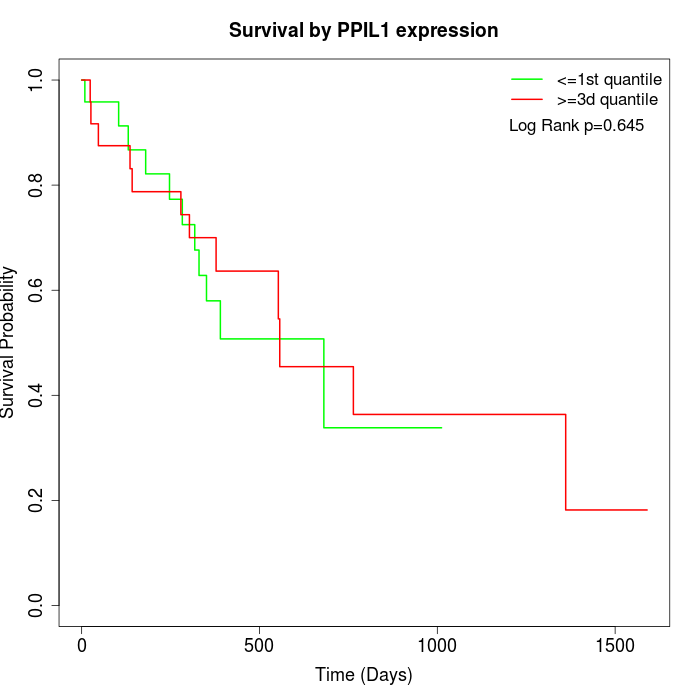 |
| GSE53622 | GSE53624 | TCGA |
Note: Click image to view full size file.
Copy number change of PPIL1:
| Dataset | Gene | EntrezID | Gain | Loss | Normal | Detail |
|---|---|---|---|---|---|---|
| GSE15526 | PPIL1 | 51645 | 6 | 0 | 24 | |
| GSE20123 | PPIL1 | 51645 | 6 | 0 | 24 | |
| GSE43470 | PPIL1 | 51645 | 5 | 1 | 37 | |
| GSE46452 | PPIL1 | 51645 | 2 | 9 | 48 | |
| GSE47630 | PPIL1 | 51645 | 8 | 4 | 28 | |
| GSE54993 | PPIL1 | 51645 | 3 | 1 | 66 | |
| GSE54994 | PPIL1 | 51645 | 10 | 5 | 38 | |
| GSE60625 | PPIL1 | 51645 | 1 | 0 | 10 | |
| GSE74703 | PPIL1 | 51645 | 5 | 0 | 31 | |
| GSE74704 | PPIL1 | 51645 | 3 | 0 | 17 | |
| TCGA | PPIL1 | 51645 | 15 | 15 | 66 |
Total number of gains: 64; Total number of losses: 35; Total Number of normals: 389.
Somatic mutations of PPIL1:
Generating mutation plots.
Highly correlated genes for PPIL1:
Showing top 20/1569 corelated genes with mean PCC>0.5.
| Gene1 | Gene2 | Mean PCC | Num. Datasets | Num. PCC<0 | Num. PCC>0.5 |
|---|---|---|---|---|---|
| PPIL1 | AHCY | 0.841965 | 3 | 0 | 3 |
| PPIL1 | LY75 | 0.784415 | 3 | 0 | 3 |
| PPIL1 | TRIT1 | 0.78318 | 3 | 0 | 3 |
| PPIL1 | DAZAP1 | 0.770526 | 3 | 0 | 3 |
| PPIL1 | MDH2 | 0.77024 | 3 | 0 | 3 |
| PPIL1 | MTHFD1L | 0.768273 | 3 | 0 | 3 |
| PPIL1 | CMTM6 | 0.767575 | 4 | 0 | 4 |
| PPIL1 | SSRP1 | 0.766569 | 7 | 0 | 7 |
| PPIL1 | MRPL37 | 0.764403 | 4 | 0 | 4 |
| PPIL1 | RRP36 | 0.756247 | 8 | 0 | 7 |
| PPIL1 | GUSB | 0.754723 | 3 | 0 | 3 |
| PPIL1 | SEC22A | 0.751227 | 5 | 0 | 4 |
| PPIL1 | CCP110 | 0.749356 | 4 | 0 | 4 |
| PPIL1 | SARNP | 0.747584 | 3 | 0 | 3 |
| PPIL1 | EBNA1BP2 | 0.746639 | 4 | 0 | 3 |
| PPIL1 | MRPL14 | 0.745169 | 9 | 0 | 9 |
| PPIL1 | NONO | 0.743812 | 3 | 0 | 3 |
| PPIL1 | TTC4 | 0.742397 | 6 | 0 | 6 |
| PPIL1 | ZFP69B | 0.740741 | 3 | 0 | 3 |
| PPIL1 | ANAPC1 | 0.735997 | 3 | 0 | 3 |
For details and further investigation, click here