| Full name: peptidylprolyl isomerase like 3 | Alias Symbol: CyPJ | ||
| Type: protein-coding gene | Cytoband: 2q33.1 | ||
| Entrez ID: 53938 | HGNC ID: HGNC:9262 | Ensembl Gene: ENSG00000240344 | OMIM ID: 615811 |
Expression of PPIL3:
| Dataset | Gene | EntrezID | Probe | Log2FC | Adj.pValue | Expression |
|---|---|---|---|---|---|---|
| GSE17351 | PPIL3 | 53938 | 224364_s_at | -0.1392 | 0.4898 | |
| GSE26886 | PPIL3 | 53938 | 224364_s_at | -0.3544 | 0.1947 | |
| GSE45670 | PPIL3 | 53938 | 224364_s_at | -0.2168 | 0.0936 | |
| GSE53622 | PPIL3 | 53938 | 128930 | 0.0282 | 0.7428 | |
| GSE53624 | PPIL3 | 53938 | 128930 | -0.0420 | 0.6272 | |
| GSE63941 | PPIL3 | 53938 | 224364_s_at | -0.1025 | 0.8463 | |
| GSE77861 | PPIL3 | 53938 | 224364_s_at | -0.3662 | 0.3312 | |
| GSE97050 | PPIL3 | 53938 | A_33_P3253682 | 0.1249 | 0.6191 | |
| SRP007169 | PPIL3 | 53938 | RNAseq | -0.6279 | 0.1130 | |
| SRP008496 | PPIL3 | 53938 | RNAseq | -0.5926 | 0.0291 | |
| SRP064894 | PPIL3 | 53938 | RNAseq | -0.1391 | 0.3559 | |
| SRP133303 | PPIL3 | 53938 | RNAseq | 0.0450 | 0.7911 | |
| SRP159526 | PPIL3 | 53938 | RNAseq | -0.4440 | 0.0447 | |
| SRP193095 | PPIL3 | 53938 | RNAseq | -0.6463 | 0.0000 | |
| SRP219564 | PPIL3 | 53938 | RNAseq | -0.4371 | 0.0343 | |
| TCGA | PPIL3 | 53938 | RNAseq | 0.0495 | 0.4550 |
Upregulated datasets: 0; Downregulated datasets: 0.
Survival by PPIL3 expression:
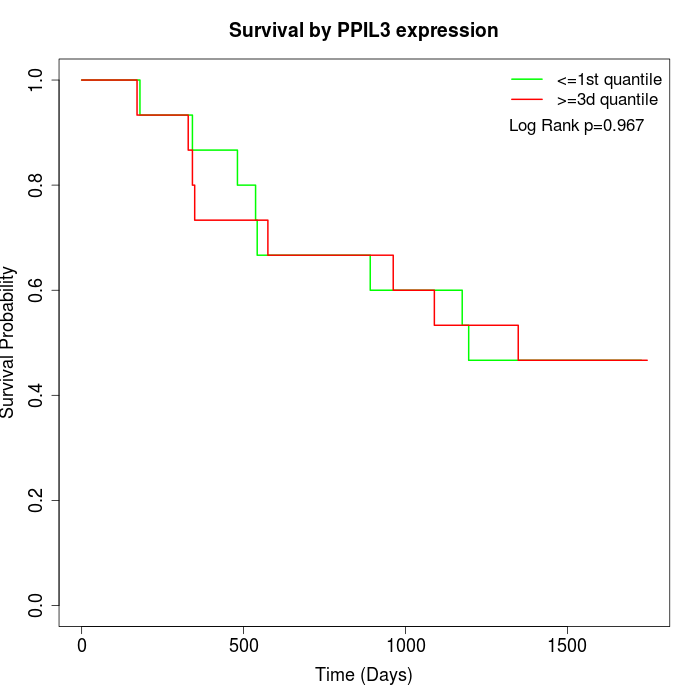 | 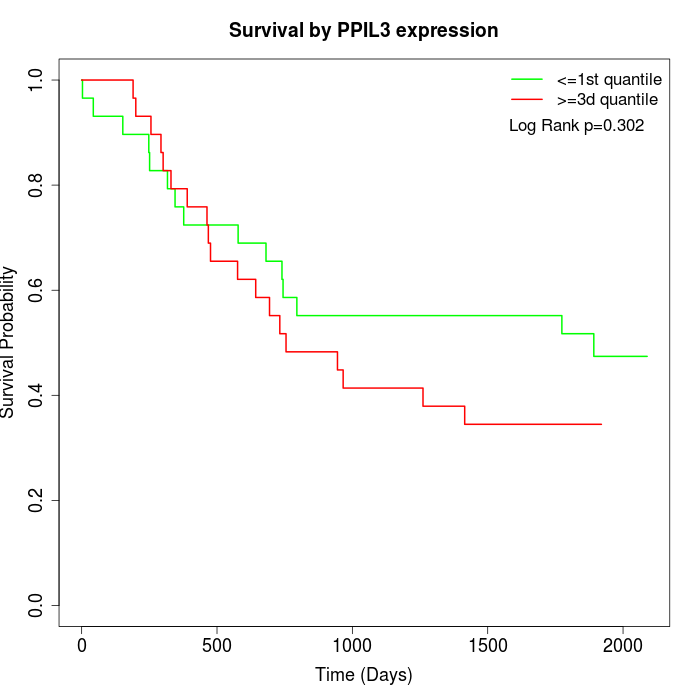 | 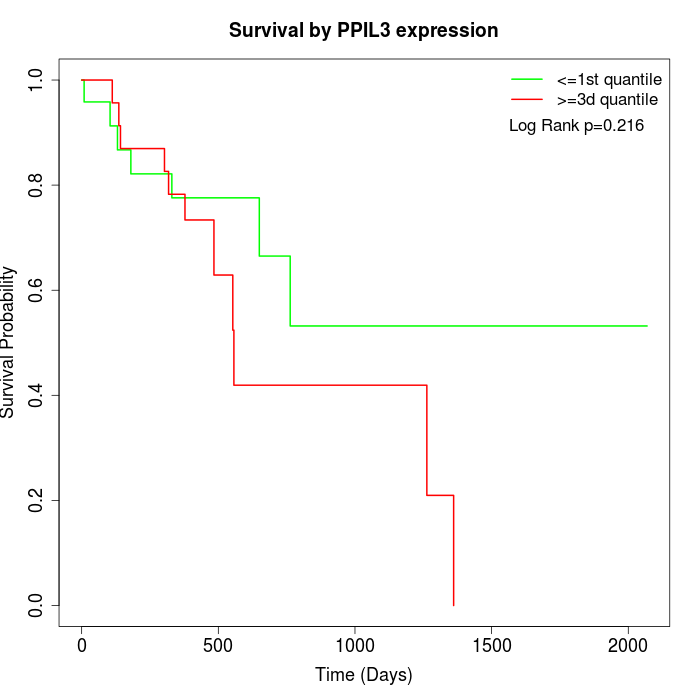 |
| GSE53622 | GSE53624 | TCGA |
Note: Click image to view full size file.
Copy number change of PPIL3:
| Dataset | Gene | EntrezID | Gain | Loss | Normal | Detail |
|---|---|---|---|---|---|---|
| GSE15526 | PPIL3 | 53938 | 6 | 4 | 20 | |
| GSE20123 | PPIL3 | 53938 | 6 | 4 | 20 | |
| GSE43470 | PPIL3 | 53938 | 2 | 1 | 40 | |
| GSE46452 | PPIL3 | 53938 | 1 | 4 | 54 | |
| GSE47630 | PPIL3 | 53938 | 4 | 5 | 31 | |
| GSE54993 | PPIL3 | 53938 | 0 | 3 | 67 | |
| GSE54994 | PPIL3 | 53938 | 10 | 8 | 35 | |
| GSE60625 | PPIL3 | 53938 | 0 | 3 | 8 | |
| GSE74703 | PPIL3 | 53938 | 2 | 1 | 33 | |
| GSE74704 | PPIL3 | 53938 | 3 | 2 | 15 | |
| TCGA | PPIL3 | 53938 | 22 | 11 | 63 |
Total number of gains: 56; Total number of losses: 46; Total Number of normals: 386.
Somatic mutations of PPIL3:
Generating mutation plots.
Highly correlated genes for PPIL3:
Showing top 20/278 corelated genes with mean PCC>0.5.
| Gene1 | Gene2 | Mean PCC | Num. Datasets | Num. PCC<0 | Num. PCC>0.5 |
|---|---|---|---|---|---|
| PPIL3 | NFKB1 | 0.801457 | 3 | 0 | 3 |
| PPIL3 | FASTKD2 | 0.779118 | 3 | 0 | 3 |
| PPIL3 | FAM114A2 | 0.76933 | 3 | 0 | 3 |
| PPIL3 | ZNF266 | 0.751481 | 3 | 0 | 3 |
| PPIL3 | CPA3 | 0.74963 | 3 | 0 | 3 |
| PPIL3 | WDR11 | 0.746325 | 4 | 0 | 4 |
| PPIL3 | TRERF1 | 0.738536 | 3 | 0 | 3 |
| PPIL3 | PGM1 | 0.730504 | 3 | 0 | 3 |
| PPIL3 | PKN2 | 0.728303 | 3 | 0 | 3 |
| PPIL3 | ATF6 | 0.723381 | 3 | 0 | 3 |
| PPIL3 | FLI1 | 0.717231 | 3 | 0 | 3 |
| PPIL3 | TMEM17 | 0.712937 | 3 | 0 | 3 |
| PPIL3 | NDUFB6 | 0.70524 | 3 | 0 | 3 |
| PPIL3 | PIGM | 0.701939 | 3 | 0 | 3 |
| PPIL3 | CPVL | 0.695688 | 4 | 0 | 4 |
| PPIL3 | CNPPD1 | 0.694461 | 3 | 0 | 3 |
| PPIL3 | KLHL2 | 0.693184 | 3 | 0 | 3 |
| PPIL3 | MTM1 | 0.692528 | 4 | 0 | 3 |
| PPIL3 | RBAK | 0.692276 | 3 | 0 | 3 |
| PPIL3 | PARP4 | 0.691388 | 5 | 0 | 5 |
For details and further investigation, click here