| Full name: proline rich protein BstNI subfamily 3 | Alias Symbol: PRG | ||
| Type: protein-coding gene | Cytoband: 12p13.2 | ||
| Entrez ID: 5544 | HGNC ID: HGNC:9339 | Ensembl Gene: ENSG00000197870 | OMIM ID: 168840 |
Expression of PRB3:
| Dataset | Gene | EntrezID | Probe | Log2FC | Adj.pValue | Expression |
|---|---|---|---|---|---|---|
| GSE17351 | PRB3 | 5544 | 206998_x_at | 0.1685 | 0.4864 | |
| GSE20347 | PRB3 | 5544 | 206998_x_at | 0.1470 | 0.1212 | |
| GSE23400 | PRB3 | 5544 | 206998_x_at | -0.0483 | 0.1627 | |
| GSE26886 | PRB3 | 5544 | 206998_x_at | 0.0756 | 0.7232 | |
| GSE29001 | PRB3 | 5544 | 206998_x_at | -0.1928 | 0.1461 | |
| GSE38129 | PRB3 | 5544 | 206998_x_at | 0.2033 | 0.0653 | |
| GSE45670 | PRB3 | 5544 | 206998_x_at | 0.1327 | 0.1664 | |
| GSE53622 | PRB3 | 5544 | 85972 | -0.3225 | 0.0250 | |
| GSE53624 | PRB3 | 5544 | 85972 | -0.8638 | 0.0000 | |
| GSE63941 | PRB3 | 5544 | 206998_x_at | 0.8011 | 0.0055 | |
| GSE77861 | PRB3 | 5544 | 206998_x_at | 0.0154 | 0.9263 | |
| GSE97050 | PRB3 | 5544 | A_33_P3256334 | -0.7359 | 0.2433 | |
| SRP133303 | PRB3 | 5544 | RNAseq | -0.3213 | 0.4378 | |
| TCGA | PRB3 | 5544 | RNAseq | 2.6368 | 0.0000 |
Upregulated datasets: 1; Downregulated datasets: 0.
Survival by PRB3 expression:
 | 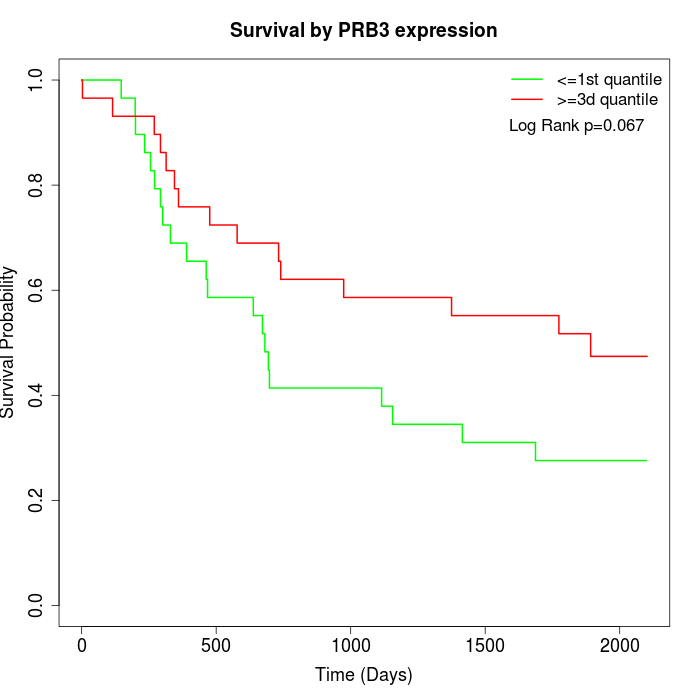 | 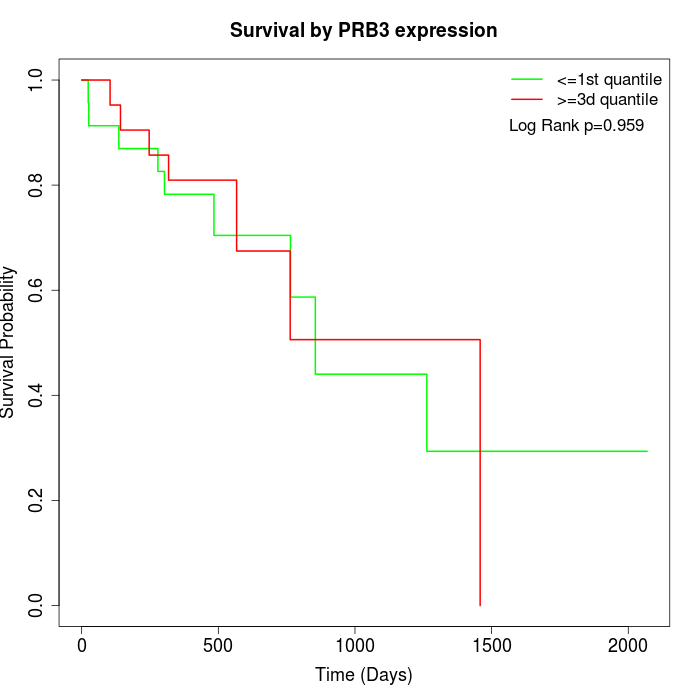 |
| GSE53622 | GSE53624 | TCGA |
Note: Click image to view full size file.
Copy number change of PRB3:
| Dataset | Gene | EntrezID | Gain | Loss | Normal | Detail |
|---|---|---|---|---|---|---|
| GSE15526 | PRB3 | 5544 | 6 | 2 | 22 | |
| GSE20123 | PRB3 | 5544 | 6 | 2 | 22 | |
| GSE43470 | PRB3 | 5544 | 9 | 3 | 31 | |
| GSE46452 | PRB3 | 5544 | 10 | 1 | 48 | |
| GSE47630 | PRB3 | 5544 | 14 | 2 | 24 | |
| GSE54993 | PRB3 | 5544 | 1 | 9 | 60 | |
| GSE54994 | PRB3 | 5544 | 10 | 2 | 41 | |
| GSE60625 | PRB3 | 5544 | 0 | 1 | 10 | |
| GSE74703 | PRB3 | 5544 | 9 | 2 | 25 | |
| GSE74704 | PRB3 | 5544 | 4 | 1 | 15 | |
| TCGA | PRB3 | 5544 | 39 | 7 | 50 |
Total number of gains: 108; Total number of losses: 32; Total Number of normals: 348.
Somatic mutations of PRB3:
Generating mutation plots.
Highly correlated genes for PRB3:
Showing top 20/314 corelated genes with mean PCC>0.5.
| Gene1 | Gene2 | Mean PCC | Num. Datasets | Num. PCC<0 | Num. PCC>0.5 |
|---|---|---|---|---|---|
| PRB3 | PRH2 | 0.813371 | 3 | 0 | 3 |
| PRB3 | PRB4 | 0.689182 | 10 | 0 | 8 |
| PRB3 | AIF1L | 0.687592 | 3 | 0 | 3 |
| PRB3 | LINC00167 | 0.670615 | 3 | 0 | 3 |
| PRB3 | CAMK2B | 0.655812 | 6 | 0 | 6 |
| PRB3 | CLDN24 | 0.645807 | 3 | 0 | 3 |
| PRB3 | SYNGAP1 | 0.641509 | 3 | 0 | 3 |
| PRB3 | GPR22 | 0.638381 | 3 | 0 | 3 |
| PRB3 | MYOG | 0.63794 | 3 | 0 | 3 |
| PRB3 | CACNG4 | 0.637636 | 7 | 0 | 4 |
| PRB3 | MOSPD3 | 0.636604 | 5 | 0 | 3 |
| PRB3 | FOXN3-AS2 | 0.636215 | 5 | 0 | 5 |
| PRB3 | TBC1D10B | 0.630405 | 5 | 0 | 4 |
| PRB3 | KIAA1522 | 0.626393 | 3 | 0 | 3 |
| PRB3 | PIP | 0.622702 | 5 | 0 | 5 |
| PRB3 | S1PR4 | 0.62223 | 4 | 0 | 4 |
| PRB3 | ZNF835 | 0.618969 | 5 | 0 | 4 |
| PRB3 | SNTG1 | 0.618637 | 3 | 0 | 3 |
| PRB3 | MAT1A | 0.617835 | 5 | 0 | 4 |
| PRB3 | LIPE | 0.615068 | 4 | 0 | 3 |
For details and further investigation, click here