| Full name: proline-serine-threonine phosphatase interacting protein 2 | Alias Symbol: | ||
| Type: protein-coding gene | Cytoband: 18q21.1 | ||
| Entrez ID: 9050 | HGNC ID: HGNC:9581 | Ensembl Gene: ENSG00000152229 | OMIM ID: 616046 |
Expression of PSTPIP2:
| Dataset | Gene | EntrezID | Probe | Log2FC | Adj.pValue | Expression |
|---|---|---|---|---|---|---|
| GSE17351 | PSTPIP2 | 9050 | 219938_s_at | 0.9391 | 0.2084 | |
| GSE20347 | PSTPIP2 | 9050 | 219938_s_at | 0.2540 | 0.3092 | |
| GSE23400 | PSTPIP2 | 9050 | 219938_s_at | 0.1880 | 0.0052 | |
| GSE26886 | PSTPIP2 | 9050 | 219938_s_at | 0.2509 | 0.6783 | |
| GSE29001 | PSTPIP2 | 9050 | 219938_s_at | 0.1762 | 0.6143 | |
| GSE38129 | PSTPIP2 | 9050 | 219938_s_at | 0.4944 | 0.0121 | |
| GSE45670 | PSTPIP2 | 9050 | 219938_s_at | 0.6040 | 0.0851 | |
| GSE53622 | PSTPIP2 | 9050 | 70001 | 0.9619 | 0.0000 | |
| GSE53624 | PSTPIP2 | 9050 | 70001 | 0.7533 | 0.0000 | |
| GSE63941 | PSTPIP2 | 9050 | 219938_s_at | 0.5053 | 0.5607 | |
| GSE77861 | PSTPIP2 | 9050 | 219938_s_at | 0.2669 | 0.4164 | |
| GSE97050 | PSTPIP2 | 9050 | A_24_P322353 | 0.5367 | 0.2307 | |
| SRP007169 | PSTPIP2 | 9050 | RNAseq | 1.2538 | 0.0326 | |
| SRP008496 | PSTPIP2 | 9050 | RNAseq | 2.1222 | 0.0050 | |
| SRP064894 | PSTPIP2 | 9050 | RNAseq | -0.1286 | 0.5985 | |
| SRP133303 | PSTPIP2 | 9050 | RNAseq | 0.6024 | 0.0053 | |
| SRP159526 | PSTPIP2 | 9050 | RNAseq | 0.5182 | 0.0324 | |
| SRP193095 | PSTPIP2 | 9050 | RNAseq | 0.6325 | 0.0028 | |
| SRP219564 | PSTPIP2 | 9050 | RNAseq | 0.1912 | 0.6627 | |
| TCGA | PSTPIP2 | 9050 | RNAseq | 0.1767 | 0.1175 |
Upregulated datasets: 2; Downregulated datasets: 0.
Survival by PSTPIP2 expression:
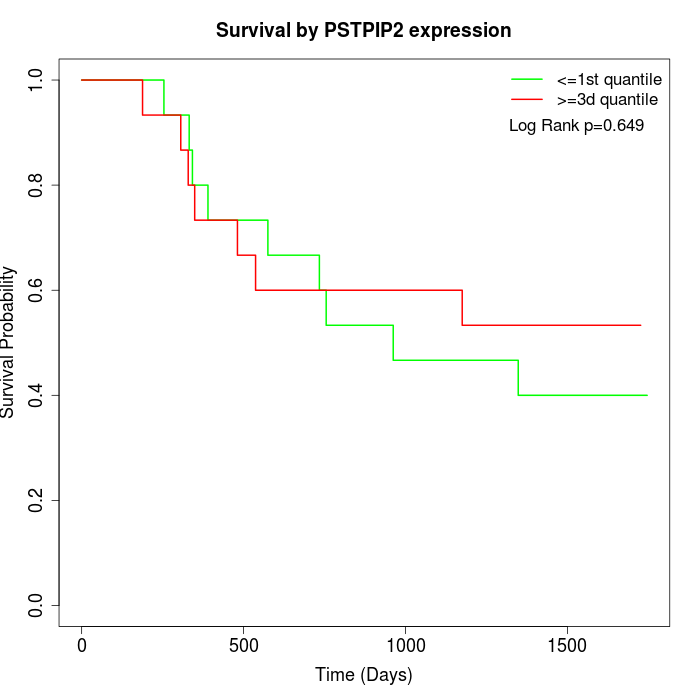 | 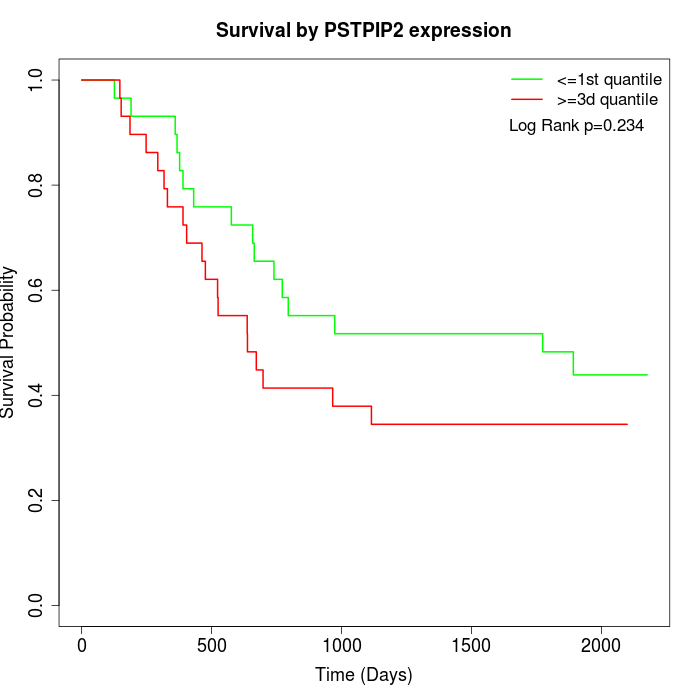 | 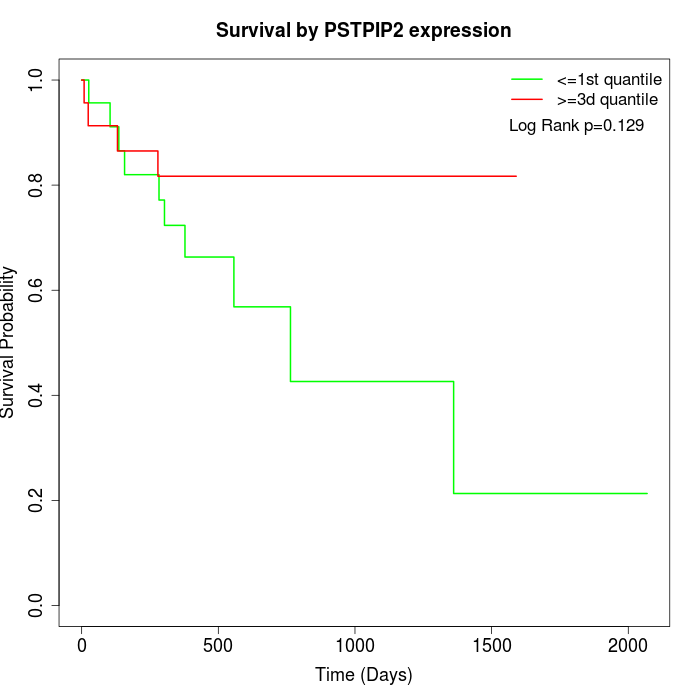 |
| GSE53622 | GSE53624 | TCGA |
Note: Click image to view full size file.
Copy number change of PSTPIP2:
| Dataset | Gene | EntrezID | Gain | Loss | Normal | Detail |
|---|---|---|---|---|---|---|
| GSE15526 | PSTPIP2 | 9050 | 1 | 8 | 21 | |
| GSE20123 | PSTPIP2 | 9050 | 1 | 8 | 21 | |
| GSE43470 | PSTPIP2 | 9050 | 0 | 4 | 39 | |
| GSE46452 | PSTPIP2 | 9050 | 1 | 26 | 32 | |
| GSE47630 | PSTPIP2 | 9050 | 5 | 20 | 15 | |
| GSE54993 | PSTPIP2 | 9050 | 8 | 1 | 61 | |
| GSE54994 | PSTPIP2 | 9050 | 2 | 15 | 36 | |
| GSE60625 | PSTPIP2 | 9050 | 0 | 4 | 7 | |
| GSE74703 | PSTPIP2 | 9050 | 0 | 3 | 33 | |
| GSE74704 | PSTPIP2 | 9050 | 0 | 6 | 14 | |
| TCGA | PSTPIP2 | 9050 | 15 | 40 | 41 |
Total number of gains: 33; Total number of losses: 135; Total Number of normals: 320.
Somatic mutations of PSTPIP2:
Generating mutation plots.
Highly correlated genes for PSTPIP2:
Showing top 20/583 corelated genes with mean PCC>0.5.
| Gene1 | Gene2 | Mean PCC | Num. Datasets | Num. PCC<0 | Num. PCC>0.5 |
|---|---|---|---|---|---|
| PSTPIP2 | PREX1 | 0.819884 | 3 | 0 | 3 |
| PSTPIP2 | CISD2 | 0.779305 | 3 | 0 | 3 |
| PSTPIP2 | INTS10 | 0.777911 | 3 | 0 | 3 |
| PSTPIP2 | MS4A14 | 0.73335 | 3 | 0 | 3 |
| PSTPIP2 | HELB | 0.73036 | 3 | 0 | 3 |
| PSTPIP2 | MAN1A2 | 0.726217 | 3 | 0 | 3 |
| PSTPIP2 | DDX60L | 0.718164 | 3 | 0 | 3 |
| PSTPIP2 | DGKD | 0.714801 | 3 | 0 | 3 |
| PSTPIP2 | C1orf115 | 0.714119 | 3 | 0 | 3 |
| PSTPIP2 | CCT6A | 0.711921 | 3 | 0 | 3 |
| PSTPIP2 | METTL17 | 0.705217 | 3 | 0 | 3 |
| PSTPIP2 | MAZ | 0.699168 | 3 | 0 | 3 |
| PSTPIP2 | CDCA7 | 0.697528 | 4 | 0 | 3 |
| PSTPIP2 | TRAF5 | 0.696347 | 3 | 0 | 3 |
| PSTPIP2 | NAB2 | 0.695388 | 3 | 0 | 3 |
| PSTPIP2 | CELSR2 | 0.692514 | 3 | 0 | 3 |
| PSTPIP2 | HORMAD1 | 0.688591 | 3 | 0 | 3 |
| PSTPIP2 | RNF145 | 0.685588 | 3 | 0 | 3 |
| PSTPIP2 | FNTA | 0.684851 | 3 | 0 | 3 |
| PSTPIP2 | LRP4 | 0.684102 | 3 | 0 | 3 |
For details and further investigation, click here