| Full name: regulator of chromosome condensation 2 | Alias Symbol: TD-60 | ||
| Type: protein-coding gene | Cytoband: 1p36.13 | ||
| Entrez ID: 55920 | HGNC ID: HGNC:30297 | Ensembl Gene: ENSG00000179051 | OMIM ID: 609587 |
Expression of RCC2:
| Dataset | Gene | EntrezID | Probe | Log2FC | Adj.pValue | Expression |
|---|---|---|---|---|---|---|
| GSE17351 | RCC2 | 55920 | 224578_at | 1.1581 | 0.0936 | |
| GSE26886 | RCC2 | 55920 | 224578_at | 0.2418 | 0.1221 | |
| GSE45670 | RCC2 | 55920 | 224578_at | 0.7630 | 0.0000 | |
| GSE53622 | RCC2 | 55920 | 45057 | 0.9993 | 0.0000 | |
| GSE53624 | RCC2 | 55920 | 31735 | 0.5883 | 0.0000 | |
| GSE63941 | RCC2 | 55920 | 224578_at | 2.0125 | 0.0001 | |
| GSE77861 | RCC2 | 55920 | 224578_at | 0.5069 | 0.0279 | |
| GSE97050 | RCC2 | 55920 | A_33_P3215517 | 1.6202 | 0.0555 | |
| SRP007169 | RCC2 | 55920 | RNAseq | 1.3488 | 0.0182 | |
| SRP008496 | RCC2 | 55920 | RNAseq | 1.2687 | 0.0003 | |
| SRP064894 | RCC2 | 55920 | RNAseq | 0.6358 | 0.0014 | |
| SRP133303 | RCC2 | 55920 | RNAseq | 0.7314 | 0.0001 | |
| SRP159526 | RCC2 | 55920 | RNAseq | 1.2181 | 0.0077 | |
| SRP193095 | RCC2 | 55920 | RNAseq | 0.6774 | 0.0000 | |
| SRP219564 | RCC2 | 55920 | RNAseq | 0.4174 | 0.3899 | |
| TCGA | RCC2 | 55920 | RNAseq | 0.4561 | 0.0000 |
Upregulated datasets: 4; Downregulated datasets: 0.
Survival by RCC2 expression:
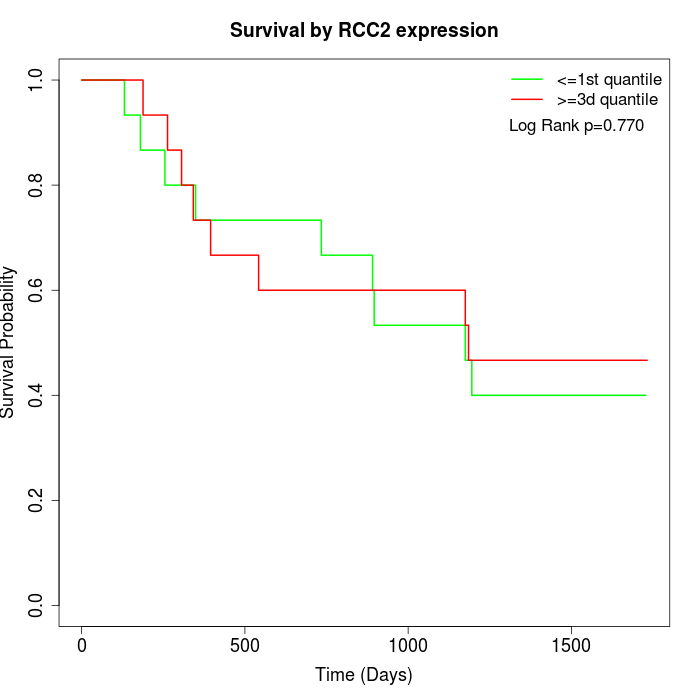 |  | 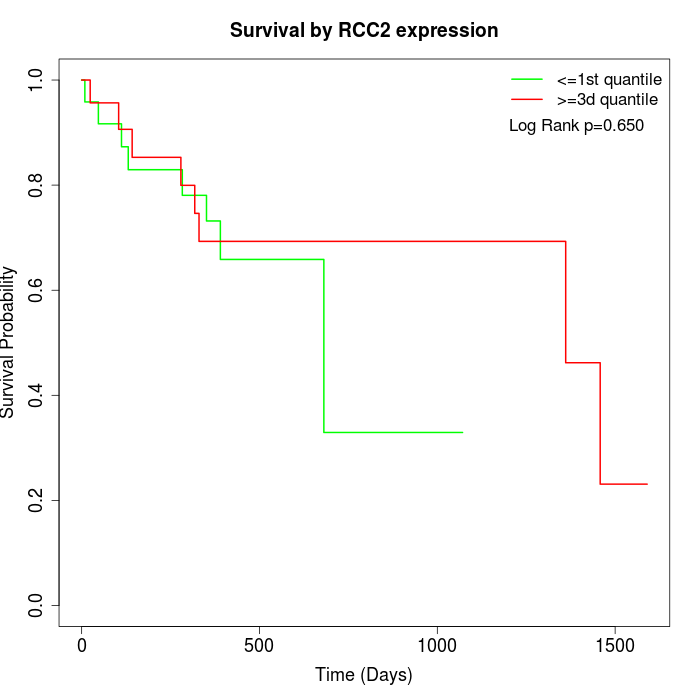 |
| GSE53622 | GSE53624 | TCGA |
Note: Click image to view full size file.
Copy number change of RCC2:
| Dataset | Gene | EntrezID | Gain | Loss | Normal | Detail |
|---|---|---|---|---|---|---|
| GSE15526 | RCC2 | 55920 | 0 | 5 | 25 | |
| GSE20123 | RCC2 | 55920 | 0 | 4 | 26 | |
| GSE43470 | RCC2 | 55920 | 0 | 8 | 35 | |
| GSE46452 | RCC2 | 55920 | 5 | 1 | 53 | |
| GSE47630 | RCC2 | 55920 | 8 | 3 | 29 | |
| GSE54993 | RCC2 | 55920 | 3 | 1 | 66 | |
| GSE54994 | RCC2 | 55920 | 10 | 4 | 39 | |
| GSE60625 | RCC2 | 55920 | 0 | 0 | 11 | |
| GSE74703 | RCC2 | 55920 | 0 | 5 | 31 | |
| GSE74704 | RCC2 | 55920 | 0 | 0 | 20 | |
| TCGA | RCC2 | 55920 | 10 | 22 | 64 |
Total number of gains: 36; Total number of losses: 53; Total Number of normals: 399.
Somatic mutations of RCC2:
Generating mutation plots.
Highly correlated genes for RCC2:
Showing top 20/1387 corelated genes with mean PCC>0.5.
| Gene1 | Gene2 | Mean PCC | Num. Datasets | Num. PCC<0 | Num. PCC>0.5 |
|---|---|---|---|---|---|
| RCC2 | PRKCZ | 0.764286 | 3 | 0 | 3 |
| RCC2 | KIF2C | 0.756589 | 7 | 0 | 7 |
| RCC2 | HIP1R | 0.748301 | 3 | 0 | 3 |
| RCC2 | SLC7A5 | 0.73936 | 6 | 0 | 6 |
| RCC2 | TUBA1B | 0.733856 | 3 | 0 | 3 |
| RCC2 | BUB1 | 0.732167 | 7 | 0 | 6 |
| RCC2 | TPX2 | 0.731723 | 7 | 0 | 6 |
| RCC2 | PLK1 | 0.73147 | 7 | 0 | 6 |
| RCC2 | FSCN1 | 0.730363 | 6 | 0 | 5 |
| RCC2 | NCAPH | 0.729199 | 4 | 0 | 4 |
| RCC2 | HELLS | 0.728669 | 6 | 0 | 6 |
| RCC2 | PPP3CA | 0.728525 | 3 | 0 | 3 |
| RCC2 | CASP2 | 0.723982 | 6 | 0 | 5 |
| RCC2 | G3BP1 | 0.723548 | 4 | 0 | 4 |
| RCC2 | UHRF1 | 0.723503 | 7 | 0 | 6 |
| RCC2 | TMC6 | 0.722235 | 5 | 0 | 5 |
| RCC2 | MYBL2 | 0.721939 | 7 | 0 | 7 |
| RCC2 | TOP2A | 0.721886 | 7 | 0 | 5 |
| RCC2 | TFIP11 | 0.72179 | 3 | 0 | 3 |
| RCC2 | SMC4 | 0.720996 | 4 | 0 | 4 |
For details and further investigation, click here