| Full name: PTOV1 extended AT-hook containing adaptor protein | Alias Symbol: | ||
| Type: protein-coding gene | Cytoband: 19q13.33 | ||
| Entrez ID: 53635 | HGNC ID: HGNC:9632 | Ensembl Gene: ENSG00000104960 | OMIM ID: 610195 |
Expression of PTOV1:
| Dataset | Gene | EntrezID | Probe | Log2FC | Adj.pValue | Expression |
|---|---|---|---|---|---|---|
| GSE17351 | PTOV1 | 53635 | 212032_s_at | 0.5478 | 0.2311 | |
| GSE20347 | PTOV1 | 53635 | 212032_s_at | 0.1381 | 0.2396 | |
| GSE23400 | PTOV1 | 53635 | 212032_s_at | 0.2639 | 0.0012 | |
| GSE26886 | PTOV1 | 53635 | 212032_s_at | 1.0513 | 0.0002 | |
| GSE29001 | PTOV1 | 53635 | 212032_s_at | -0.0164 | 0.9669 | |
| GSE38129 | PTOV1 | 53635 | 212032_s_at | 0.1733 | 0.1065 | |
| GSE45670 | PTOV1 | 53635 | 212032_s_at | 0.3657 | 0.0642 | |
| GSE53622 | PTOV1 | 53635 | 121202 | 0.0367 | 0.6020 | |
| GSE53624 | PTOV1 | 53635 | 121202 | 0.2697 | 0.0001 | |
| GSE63941 | PTOV1 | 53635 | 212032_s_at | 0.4669 | 0.1940 | |
| GSE77861 | PTOV1 | 53635 | 212032_s_at | 0.2395 | 0.4539 | |
| GSE97050 | PTOV1 | 53635 | A_24_P219808 | -0.0676 | 0.8073 | |
| SRP007169 | PTOV1 | 53635 | RNAseq | -0.7186 | 0.0776 | |
| SRP008496 | PTOV1 | 53635 | RNAseq | -0.8604 | 0.0007 | |
| SRP064894 | PTOV1 | 53635 | RNAseq | 0.8829 | 0.0128 | |
| SRP133303 | PTOV1 | 53635 | RNAseq | 0.0137 | 0.9202 | |
| SRP159526 | PTOV1 | 53635 | RNAseq | 0.5676 | 0.1441 | |
| SRP193095 | PTOV1 | 53635 | RNAseq | 0.1540 | 0.2620 | |
| SRP219564 | PTOV1 | 53635 | RNAseq | 0.2423 | 0.4543 | |
| TCGA | PTOV1 | 53635 | RNAseq | -0.0274 | 0.5391 |
Upregulated datasets: 1; Downregulated datasets: 0.
Survival by PTOV1 expression:
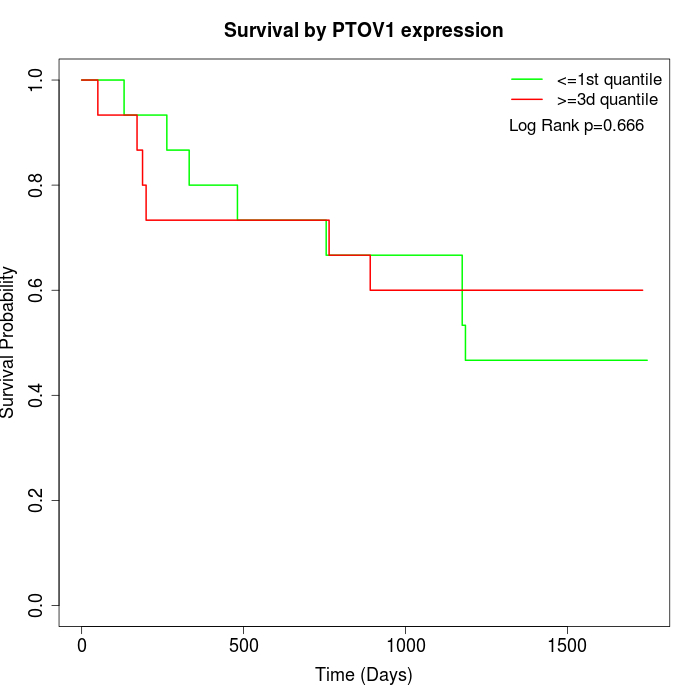 | 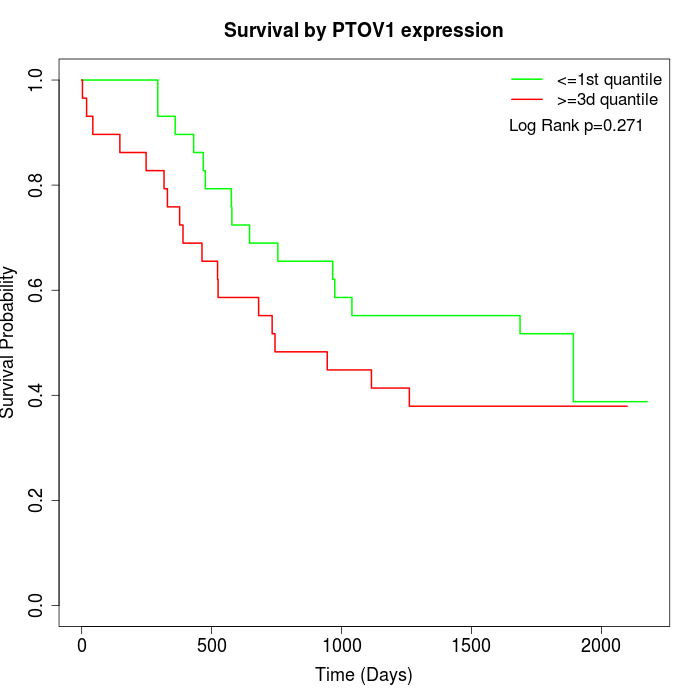 | 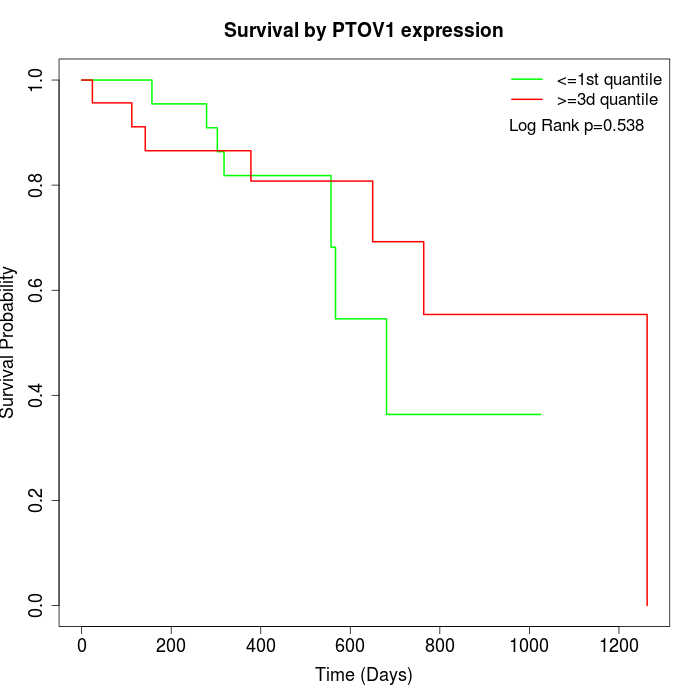 |
| GSE53622 | GSE53624 | TCGA |
Note: Click image to view full size file.
Copy number change of PTOV1:
| Dataset | Gene | EntrezID | Gain | Loss | Normal | Detail |
|---|---|---|---|---|---|---|
| GSE15526 | PTOV1 | 53635 | 4 | 4 | 22 | |
| GSE20123 | PTOV1 | 53635 | 4 | 3 | 23 | |
| GSE43470 | PTOV1 | 53635 | 5 | 11 | 27 | |
| GSE46452 | PTOV1 | 53635 | 45 | 1 | 13 | |
| GSE47630 | PTOV1 | 53635 | 10 | 6 | 24 | |
| GSE54993 | PTOV1 | 53635 | 17 | 4 | 49 | |
| GSE54994 | PTOV1 | 53635 | 4 | 14 | 35 | |
| GSE60625 | PTOV1 | 53635 | 9 | 0 | 2 | |
| GSE74703 | PTOV1 | 53635 | 5 | 7 | 24 | |
| GSE74704 | PTOV1 | 53635 | 4 | 1 | 15 | |
| TCGA | PTOV1 | 53635 | 14 | 18 | 64 |
Total number of gains: 121; Total number of losses: 69; Total Number of normals: 298.
Somatic mutations of PTOV1:
Generating mutation plots.
Highly correlated genes for PTOV1:
Showing top 20/776 corelated genes with mean PCC>0.5.
| Gene1 | Gene2 | Mean PCC | Num. Datasets | Num. PCC<0 | Num. PCC>0.5 |
|---|---|---|---|---|---|
| PTOV1 | ZNF830 | 0.805467 | 3 | 0 | 3 |
| PTOV1 | TFDP2 | 0.801222 | 3 | 0 | 3 |
| PTOV1 | RP9 | 0.78486 | 3 | 0 | 3 |
| PTOV1 | WDR75 | 0.784646 | 3 | 0 | 3 |
| PTOV1 | CPLX1 | 0.778738 | 3 | 0 | 3 |
| PTOV1 | ZNF417 | 0.771344 | 3 | 0 | 3 |
| PTOV1 | UTP23 | 0.767925 | 3 | 0 | 3 |
| PTOV1 | CLPP | 0.766761 | 3 | 0 | 3 |
| PTOV1 | ACBD6 | 0.765013 | 3 | 0 | 3 |
| PTOV1 | ST3GAL2 | 0.755466 | 3 | 0 | 3 |
| PTOV1 | BCAS4 | 0.754345 | 3 | 0 | 3 |
| PTOV1 | NUFIP1 | 0.740184 | 3 | 0 | 3 |
| PTOV1 | CACNA1B | 0.734821 | 3 | 0 | 3 |
| PTOV1 | DLX4 | 0.734406 | 3 | 0 | 3 |
| PTOV1 | FIP1L1 | 0.732667 | 3 | 0 | 3 |
| PTOV1 | U2SURP | 0.730456 | 4 | 0 | 4 |
| PTOV1 | SLC43A2 | 0.726798 | 3 | 0 | 3 |
| PTOV1 | CHIC1 | 0.718182 | 3 | 0 | 3 |
| PTOV1 | MADD | 0.71706 | 4 | 0 | 4 |
| PTOV1 | RNASEH2C | 0.712714 | 3 | 0 | 3 |
For details and further investigation, click here