| Full name: protein tyrosine phosphatase mitochondrial 1 | Alias Symbol: PLIP|DUSP23|MOSP | ||
| Type: protein-coding gene | Cytoband: 11p11.2 | ||
| Entrez ID: 114971 | HGNC ID: HGNC:26965 | Ensembl Gene: ENSG00000110536 | OMIM ID: 609538 |
Screen Evidence:
| |||
Expression of PTPMT1:
| Dataset | Gene | EntrezID | Probe | Log2FC | Adj.pValue | Expression |
|---|---|---|---|---|---|---|
| GSE17351 | PTPMT1 | 114971 | 225901_at | -0.0508 | 0.8905 | |
| GSE26886 | PTPMT1 | 114971 | 225901_at | 0.2909 | 0.1463 | |
| GSE45670 | PTPMT1 | 114971 | 225901_at | 0.1521 | 0.3636 | |
| GSE53622 | PTPMT1 | 114971 | 276 | 0.2887 | 0.0000 | |
| GSE53624 | PTPMT1 | 114971 | 276 | 0.5081 | 0.0000 | |
| GSE63941 | PTPMT1 | 114971 | 225901_at | 0.2347 | 0.6880 | |
| GSE77861 | PTPMT1 | 114971 | 225901_at | 0.4059 | 0.0221 | |
| GSE97050 | PTPMT1 | 114971 | A_24_P372562 | 0.3230 | 0.2467 | |
| SRP007169 | PTPMT1 | 114971 | RNAseq | -0.2627 | 0.5525 | |
| SRP008496 | PTPMT1 | 114971 | RNAseq | 0.2209 | 0.3933 | |
| SRP064894 | PTPMT1 | 114971 | RNAseq | 0.2513 | 0.2573 | |
| SRP133303 | PTPMT1 | 114971 | RNAseq | 0.4211 | 0.0005 | |
| SRP159526 | PTPMT1 | 114971 | RNAseq | 0.2958 | 0.2127 | |
| SRP193095 | PTPMT1 | 114971 | RNAseq | -0.0565 | 0.6223 | |
| SRP219564 | PTPMT1 | 114971 | RNAseq | 0.3870 | 0.1239 | |
| TCGA | PTPMT1 | 114971 | RNAseq | 0.0315 | 0.5617 |
Upregulated datasets: 0; Downregulated datasets: 0.
Survival by PTPMT1 expression:
 | 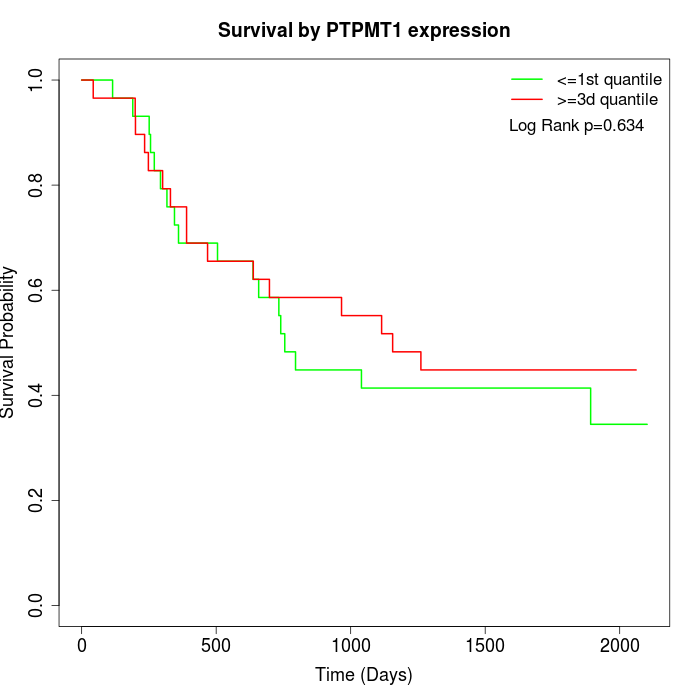 | 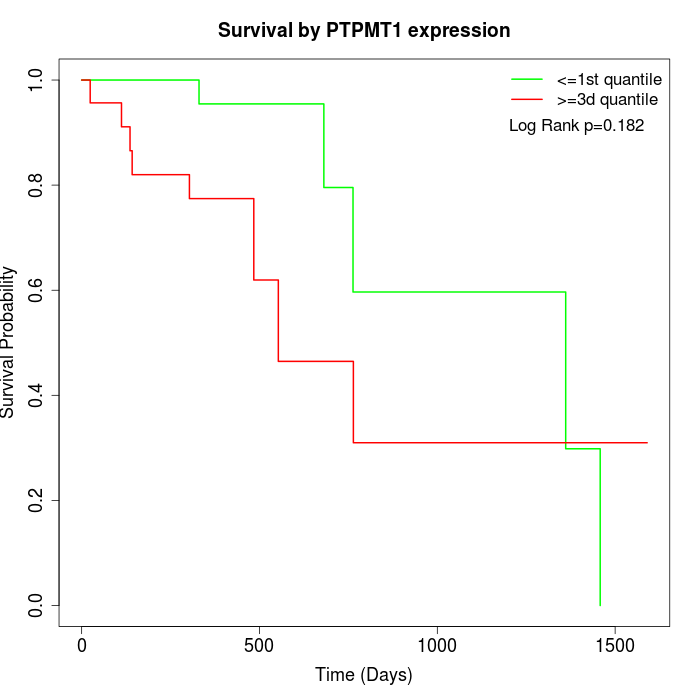 |
| GSE53622 | GSE53624 | TCGA |
Note: Click image to view full size file.
Copy number change of PTPMT1:
| Dataset | Gene | EntrezID | Gain | Loss | Normal | Detail |
|---|---|---|---|---|---|---|
| GSE15526 | PTPMT1 | 114971 | 3 | 7 | 20 | |
| GSE20123 | PTPMT1 | 114971 | 3 | 6 | 21 | |
| GSE43470 | PTPMT1 | 114971 | 1 | 4 | 38 | |
| GSE46452 | PTPMT1 | 114971 | 8 | 5 | 46 | |
| GSE47630 | PTPMT1 | 114971 | 3 | 9 | 28 | |
| GSE54993 | PTPMT1 | 114971 | 3 | 0 | 67 | |
| GSE54994 | PTPMT1 | 114971 | 1 | 11 | 41 | |
| GSE60625 | PTPMT1 | 114971 | 0 | 0 | 11 | |
| GSE74703 | PTPMT1 | 114971 | 1 | 2 | 33 | |
| GSE74704 | PTPMT1 | 114971 | 2 | 4 | 14 | |
| TCGA | PTPMT1 | 114971 | 10 | 20 | 66 |
Total number of gains: 35; Total number of losses: 68; Total Number of normals: 385.
Somatic mutations of PTPMT1:
Generating mutation plots.
Highly correlated genes for PTPMT1:
Showing top 20/686 corelated genes with mean PCC>0.5.
| Gene1 | Gene2 | Mean PCC | Num. Datasets | Num. PCC<0 | Num. PCC>0.5 |
|---|---|---|---|---|---|
| PTPMT1 | TTC26 | 0.752921 | 4 | 0 | 3 |
| PTPMT1 | ZNF384 | 0.741823 | 3 | 0 | 3 |
| PTPMT1 | VBP1 | 0.741329 | 4 | 0 | 4 |
| PTPMT1 | ABCB6 | 0.734738 | 3 | 0 | 3 |
| PTPMT1 | NCBP1 | 0.730925 | 3 | 0 | 3 |
| PTPMT1 | SASS6 | 0.729179 | 3 | 0 | 3 |
| PTPMT1 | ATP6V1E1 | 0.722363 | 3 | 0 | 3 |
| PTPMT1 | DLX5 | 0.720991 | 3 | 0 | 3 |
| PTPMT1 | RNF13 | 0.719982 | 3 | 0 | 3 |
| PTPMT1 | ZNF707 | 0.71804 | 3 | 0 | 3 |
| PTPMT1 | SNX6 | 0.715598 | 3 | 0 | 3 |
| PTPMT1 | PIK3CA | 0.714727 | 3 | 0 | 3 |
| PTPMT1 | DCTPP1 | 0.713666 | 3 | 0 | 3 |
| PTPMT1 | TFAP4 | 0.712688 | 3 | 0 | 3 |
| PTPMT1 | RIMKLB | 0.71154 | 3 | 0 | 3 |
| PTPMT1 | ABCF2 | 0.71128 | 4 | 0 | 3 |
| PTPMT1 | C9orf40 | 0.709888 | 3 | 0 | 3 |
| PTPMT1 | PSMC3 | 0.709292 | 7 | 0 | 6 |
| PTPMT1 | DTYMK | 0.70811 | 4 | 0 | 4 |
| PTPMT1 | GAS2L1 | 0.706194 | 4 | 0 | 4 |
For details and further investigation, click here