| Full name: protein tyrosine phosphatase receptor type N | Alias Symbol: IA-2|ICA512 | ||
| Type: protein-coding gene | Cytoband: 2q35 | ||
| Entrez ID: 5798 | HGNC ID: HGNC:9676 | Ensembl Gene: ENSG00000054356 | OMIM ID: 601773 |
Expression of PTPRN:
| Dataset | Gene | EntrezID | Probe | Log2FC | Adj.pValue | Expression |
|---|---|---|---|---|---|---|
| GSE17351 | PTPRN | 5798 | 204945_at | -0.1085 | 0.6287 | |
| GSE20347 | PTPRN | 5798 | 204945_at | -0.2369 | 0.0013 | |
| GSE23400 | PTPRN | 5798 | 204945_at | -0.1876 | 0.0000 | |
| GSE26886 | PTPRN | 5798 | 204945_at | -0.2154 | 0.1080 | |
| GSE29001 | PTPRN | 5798 | 204945_at | -0.2454 | 0.0290 | |
| GSE38129 | PTPRN | 5798 | 204945_at | -0.3339 | 0.0000 | |
| GSE45670 | PTPRN | 5798 | 204945_at | -0.2826 | 0.0053 | |
| GSE53622 | PTPRN | 5798 | 121574 | 0.2831 | 0.0015 | |
| GSE53624 | PTPRN | 5798 | 121574 | 0.0786 | 0.5206 | |
| GSE63941 | PTPRN | 5798 | 204945_at | 0.1880 | 0.2041 | |
| GSE77861 | PTPRN | 5798 | 204945_at | -0.3920 | 0.0419 | |
| GSE97050 | PTPRN | 5798 | A_23_P90722 | 0.0505 | 0.8570 | |
| TCGA | PTPRN | 5798 | RNAseq | -1.8077 | 0.0004 |
Upregulated datasets: 0; Downregulated datasets: 1.
Survival by PTPRN expression:
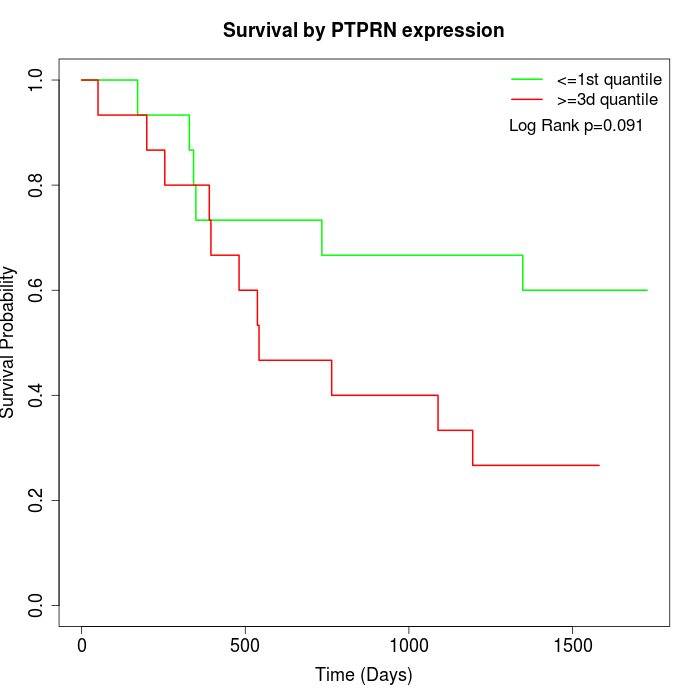 | 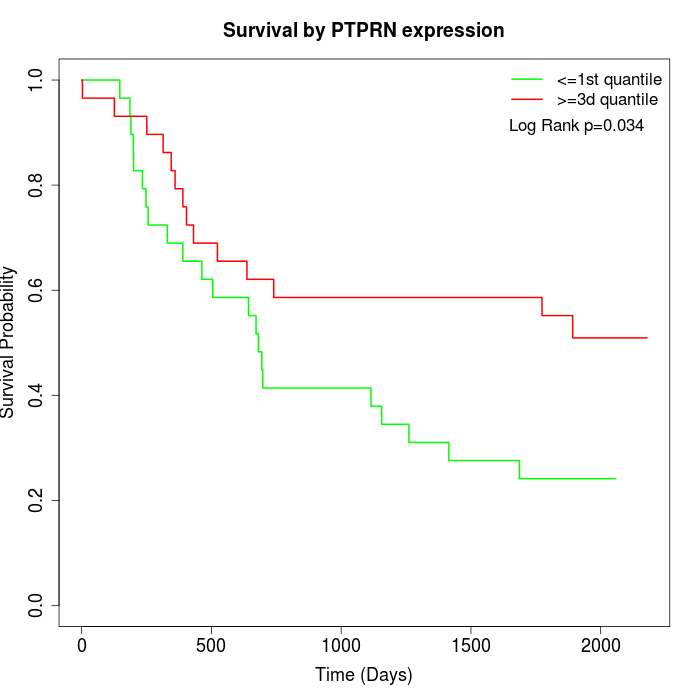 | 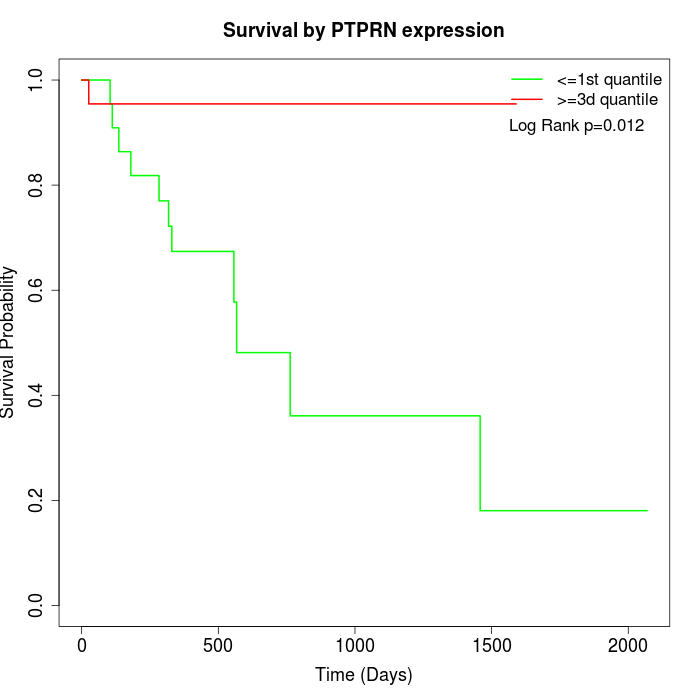 |
| GSE53622 | GSE53624 | TCGA |
Note: Click image to view full size file.
Copy number change of PTPRN:
| Dataset | Gene | EntrezID | Gain | Loss | Normal | Detail |
|---|---|---|---|---|---|---|
| GSE15526 | PTPRN | 5798 | 2 | 14 | 14 | |
| GSE20123 | PTPRN | 5798 | 2 | 13 | 15 | |
| GSE43470 | PTPRN | 5798 | 1 | 6 | 36 | |
| GSE46452 | PTPRN | 5798 | 0 | 5 | 54 | |
| GSE47630 | PTPRN | 5798 | 4 | 5 | 31 | |
| GSE54993 | PTPRN | 5798 | 1 | 2 | 67 | |
| GSE54994 | PTPRN | 5798 | 8 | 9 | 36 | |
| GSE60625 | PTPRN | 5798 | 0 | 3 | 8 | |
| GSE74703 | PTPRN | 5798 | 1 | 5 | 30 | |
| GSE74704 | PTPRN | 5798 | 2 | 7 | 11 | |
| TCGA | PTPRN | 5798 | 12 | 26 | 58 |
Total number of gains: 33; Total number of losses: 95; Total Number of normals: 360.
Somatic mutations of PTPRN:
Generating mutation plots.
Highly correlated genes for PTPRN:
Showing top 20/611 corelated genes with mean PCC>0.5.
| Gene1 | Gene2 | Mean PCC | Num. Datasets | Num. PCC<0 | Num. PCC>0.5 |
|---|---|---|---|---|---|
| PTPRN | STRC | 0.760399 | 3 | 0 | 3 |
| PTPRN | FAM171A2 | 0.748137 | 4 | 0 | 4 |
| PTPRN | FBF1 | 0.738803 | 3 | 0 | 3 |
| PTPRN | PANX2 | 0.731908 | 3 | 0 | 3 |
| PTPRN | MMP17 | 0.727229 | 3 | 0 | 3 |
| PTPRN | LRRC71 | 0.725066 | 3 | 0 | 3 |
| PTPRN | C11orf86 | 0.724747 | 4 | 0 | 4 |
| PTPRN | CDRT15 | 0.723224 | 3 | 0 | 3 |
| PTPRN | PRR18 | 0.720187 | 3 | 0 | 3 |
| PTPRN | GBP6 | 0.718978 | 3 | 0 | 3 |
| PTPRN | PLCH2 | 0.71824 | 4 | 0 | 4 |
| PTPRN | TSPAN10 | 0.717959 | 3 | 0 | 3 |
| PTPRN | SLC39A5 | 0.711373 | 3 | 0 | 3 |
| PTPRN | ZSWIM3 | 0.710325 | 3 | 0 | 3 |
| PTPRN | ANKRD33B | 0.708487 | 3 | 0 | 3 |
| PTPRN | TRIM41 | 0.703488 | 3 | 0 | 3 |
| PTPRN | ZNF527 | 0.702097 | 3 | 0 | 3 |
| PTPRN | CABP4 | 0.698052 | 3 | 0 | 3 |
| PTPRN | NPPB | 0.694405 | 4 | 0 | 4 |
| PTPRN | NOXA1 | 0.688691 | 4 | 0 | 3 |
For details and further investigation, click here