| Full name: protein tyrosine phosphatase receptor type Z1 | Alias Symbol: PTP18|RPTPB|phosphacan | ||
| Type: protein-coding gene | Cytoband: 7q31.32 | ||
| Entrez ID: 5803 | HGNC ID: HGNC:9685 | Ensembl Gene: ENSG00000106278 | OMIM ID: 176891 |
| Related drugs: PHORBOL MYRISTATE ACETATE, TRETINOIN... [more] | |||
PTPRZ1 involved pathways:
| KEGG pathway | Description | View |
|---|---|---|
| hsa05120 | Epithelial cell signaling in Helicobacter pylori infection |
Expression of PTPRZ1:
| Dataset | Gene | EntrezID | Probe | Log2FC | Adj.pValue | Expression |
|---|---|---|---|---|---|---|
| GSE17351 | PTPRZ1 | 5803 | 204469_at | -0.4097 | 0.8890 | |
| GSE20347 | PTPRZ1 | 5803 | 204469_at | 0.7481 | 0.1268 | |
| GSE23400 | PTPRZ1 | 5803 | 204469_at | 1.3404 | 0.0000 | |
| GSE26886 | PTPRZ1 | 5803 | 204469_at | 1.6303 | 0.0001 | |
| GSE29001 | PTPRZ1 | 5803 | 204469_at | 0.6576 | 0.4688 | |
| GSE38129 | PTPRZ1 | 5803 | 204469_at | 0.7443 | 0.0995 | |
| GSE45670 | PTPRZ1 | 5803 | 204469_at | 1.3736 | 0.0014 | |
| GSE53622 | PTPRZ1 | 5803 | 21452 | 1.0357 | 0.0000 | |
| GSE53624 | PTPRZ1 | 5803 | 21452 | 1.0599 | 0.0000 | |
| GSE63941 | PTPRZ1 | 5803 | 204469_at | 3.4821 | 0.1727 | |
| GSE77861 | PTPRZ1 | 5803 | 204469_at | 1.9194 | 0.0008 | |
| GSE97050 | PTPRZ1 | 5803 | A_23_P168761 | 0.7839 | 0.2839 | |
| SRP007169 | PTPRZ1 | 5803 | RNAseq | 2.7485 | 0.0000 | |
| SRP008496 | PTPRZ1 | 5803 | RNAseq | 2.5387 | 0.0000 | |
| SRP064894 | PTPRZ1 | 5803 | RNAseq | 1.2631 | 0.0157 | |
| SRP133303 | PTPRZ1 | 5803 | RNAseq | 1.0926 | 0.0003 | |
| SRP159526 | PTPRZ1 | 5803 | RNAseq | 1.0232 | 0.0190 | |
| SRP193095 | PTPRZ1 | 5803 | RNAseq | 0.7892 | 0.0071 | |
| SRP219564 | PTPRZ1 | 5803 | RNAseq | 1.2574 | 0.1660 | |
| TCGA | PTPRZ1 | 5803 | RNAseq | 0.1391 | 0.5370 |
Upregulated datasets: 11; Downregulated datasets: 0.
Survival by PTPRZ1 expression:
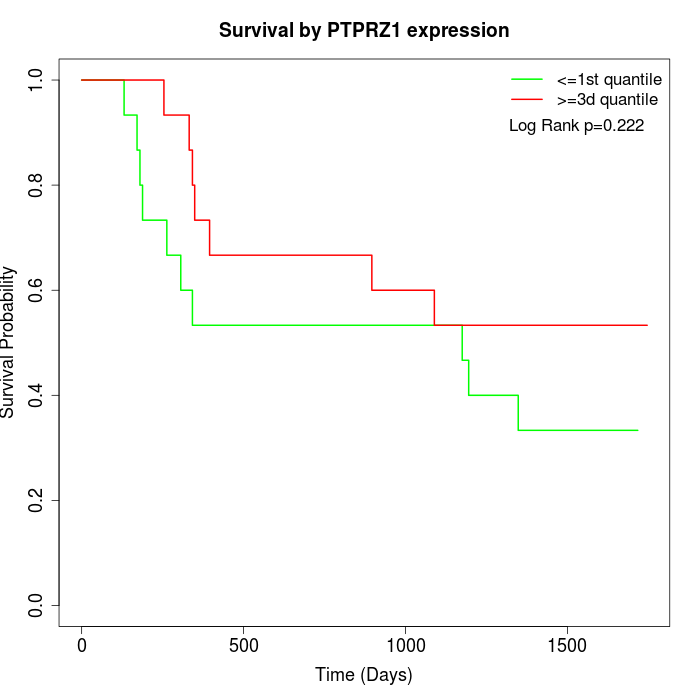 | 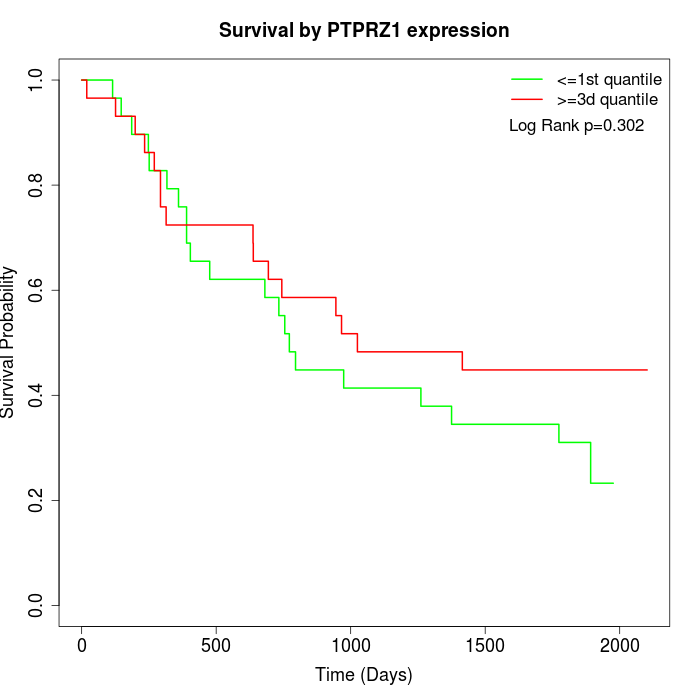 | 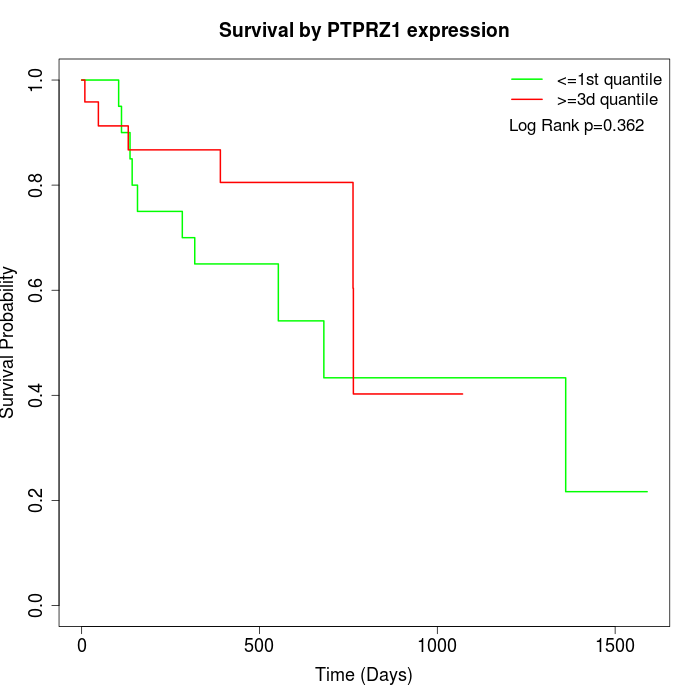 |
| GSE53622 | GSE53624 | TCGA |
Note: Click image to view full size file.
Copy number change of PTPRZ1:
| Dataset | Gene | EntrezID | Gain | Loss | Normal | Detail |
|---|---|---|---|---|---|---|
| GSE15526 | PTPRZ1 | 5803 | 7 | 2 | 21 | |
| GSE20123 | PTPRZ1 | 5803 | 8 | 2 | 20 | |
| GSE43470 | PTPRZ1 | 5803 | 2 | 4 | 37 | |
| GSE46452 | PTPRZ1 | 5803 | 8 | 1 | 50 | |
| GSE47630 | PTPRZ1 | 5803 | 7 | 4 | 29 | |
| GSE54993 | PTPRZ1 | 5803 | 3 | 5 | 62 | |
| GSE54994 | PTPRZ1 | 5803 | 10 | 6 | 37 | |
| GSE60625 | PTPRZ1 | 5803 | 0 | 0 | 11 | |
| GSE74703 | PTPRZ1 | 5803 | 2 | 4 | 30 | |
| GSE74704 | PTPRZ1 | 5803 | 5 | 2 | 13 | |
| TCGA | PTPRZ1 | 5803 | 28 | 20 | 48 |
Total number of gains: 80; Total number of losses: 50; Total Number of normals: 358.
Somatic mutations of PTPRZ1:
Generating mutation plots.
Highly correlated genes for PTPRZ1:
Showing top 20/675 corelated genes with mean PCC>0.5.
| Gene1 | Gene2 | Mean PCC | Num. Datasets | Num. PCC<0 | Num. PCC>0.5 |
|---|---|---|---|---|---|
| PTPRZ1 | SCYL1 | 0.747187 | 3 | 0 | 3 |
| PTPRZ1 | SPRED1 | 0.746787 | 4 | 0 | 4 |
| PTPRZ1 | DMXL2 | 0.725932 | 3 | 0 | 3 |
| PTPRZ1 | BLOC1S6 | 0.721321 | 3 | 0 | 3 |
| PTPRZ1 | EMILIN2 | 0.711645 | 3 | 0 | 3 |
| PTPRZ1 | CALCRL | 0.684125 | 4 | 0 | 4 |
| PTPRZ1 | ZNF275 | 0.683217 | 3 | 0 | 3 |
| PTPRZ1 | ECI1 | 0.679518 | 3 | 0 | 3 |
| PTPRZ1 | TMEM92 | 0.67894 | 3 | 0 | 3 |
| PTPRZ1 | DNAJC10 | 0.67488 | 3 | 0 | 3 |
| PTPRZ1 | NUF2 | 0.673185 | 5 | 0 | 4 |
| PTPRZ1 | CDC42EP4 | 0.671257 | 3 | 0 | 3 |
| PTPRZ1 | GABPB1 | 0.670459 | 4 | 0 | 4 |
| PTPRZ1 | FAM89A | 0.668842 | 3 | 0 | 3 |
| PTPRZ1 | TMEM17 | 0.666477 | 4 | 0 | 4 |
| PTPRZ1 | KLHL5 | 0.665896 | 3 | 0 | 3 |
| PTPRZ1 | FEN1 | 0.659629 | 4 | 0 | 3 |
| PTPRZ1 | DNPEP | 0.659044 | 3 | 0 | 3 |
| PTPRZ1 | SLFN11 | 0.654956 | 3 | 0 | 3 |
| PTPRZ1 | PIK3AP1 | 0.650095 | 4 | 0 | 3 |
For details and further investigation, click here