| Full name: phosphoinositide-3-kinase adaptor protein 1 | Alias Symbol: BCAP|FLJ35564 | ||
| Type: protein-coding gene | Cytoband: 10q24.1 | ||
| Entrez ID: 118788 | HGNC ID: HGNC:30034 | Ensembl Gene: ENSG00000155629 | OMIM ID: 607942 |
PIK3AP1 involved pathways:
| KEGG pathway | Description | View |
|---|---|---|
| hsa04151 | PI3K-Akt signaling pathway | |
| hsa04662 | B cell receptor signaling pathway |
Expression of PIK3AP1:
| Dataset | Gene | EntrezID | Probe | Log2FC | Adj.pValue | Expression |
|---|---|---|---|---|---|---|
| GSE17351 | PIK3AP1 | 118788 | 226459_at | 0.5066 | 0.7107 | |
| GSE26886 | PIK3AP1 | 118788 | 226459_at | 1.3274 | 0.0074 | |
| GSE45670 | PIK3AP1 | 118788 | 226459_at | 0.4543 | 0.3334 | |
| GSE53622 | PIK3AP1 | 118788 | 93952 | 0.8879 | 0.0000 | |
| GSE53624 | PIK3AP1 | 118788 | 93952 | 1.0026 | 0.0000 | |
| GSE63941 | PIK3AP1 | 118788 | 226459_at | -1.1207 | 0.4580 | |
| GSE77861 | PIK3AP1 | 118788 | 226459_at | 0.8713 | 0.0162 | |
| GSE97050 | PIK3AP1 | 118788 | A_33_P3879161 | 1.1316 | 0.1318 | |
| SRP007169 | PIK3AP1 | 118788 | RNAseq | 3.5354 | 0.0000 | |
| SRP008496 | PIK3AP1 | 118788 | RNAseq | 2.7062 | 0.0000 | |
| SRP064894 | PIK3AP1 | 118788 | RNAseq | 1.5601 | 0.0000 | |
| SRP133303 | PIK3AP1 | 118788 | RNAseq | 0.7715 | 0.0001 | |
| SRP159526 | PIK3AP1 | 118788 | RNAseq | 0.8125 | 0.3894 | |
| SRP193095 | PIK3AP1 | 118788 | RNAseq | 0.8541 | 0.0013 | |
| SRP219564 | PIK3AP1 | 118788 | RNAseq | 1.6051 | 0.0033 | |
| TCGA | PIK3AP1 | 118788 | RNAseq | 0.3208 | 0.0284 |
Upregulated datasets: 6; Downregulated datasets: 0.
Survival by PIK3AP1 expression:
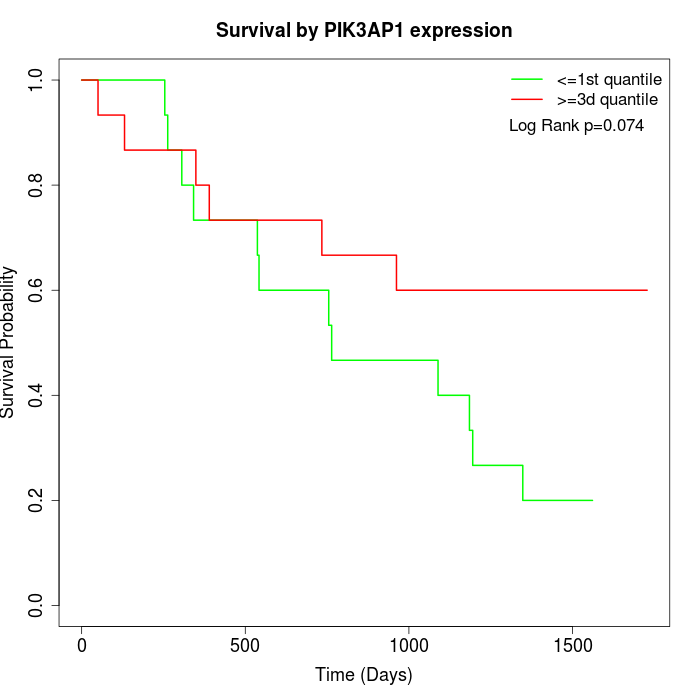 | 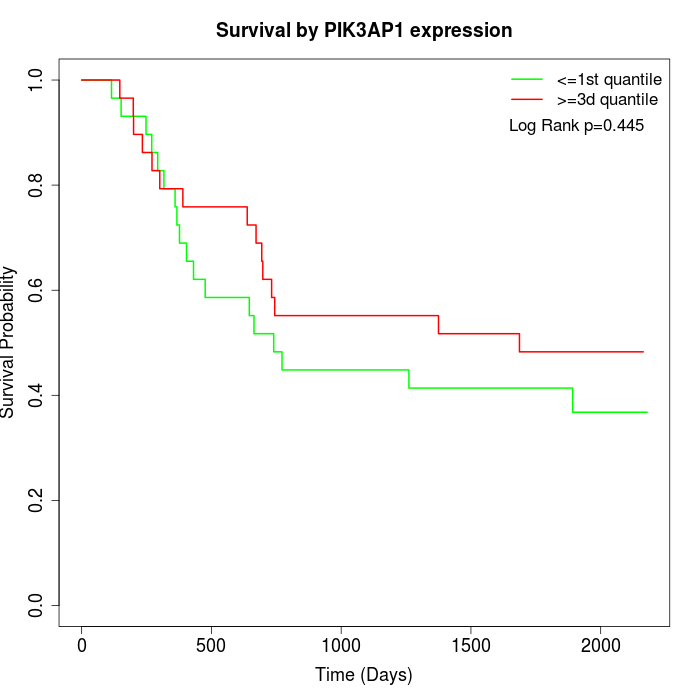 | 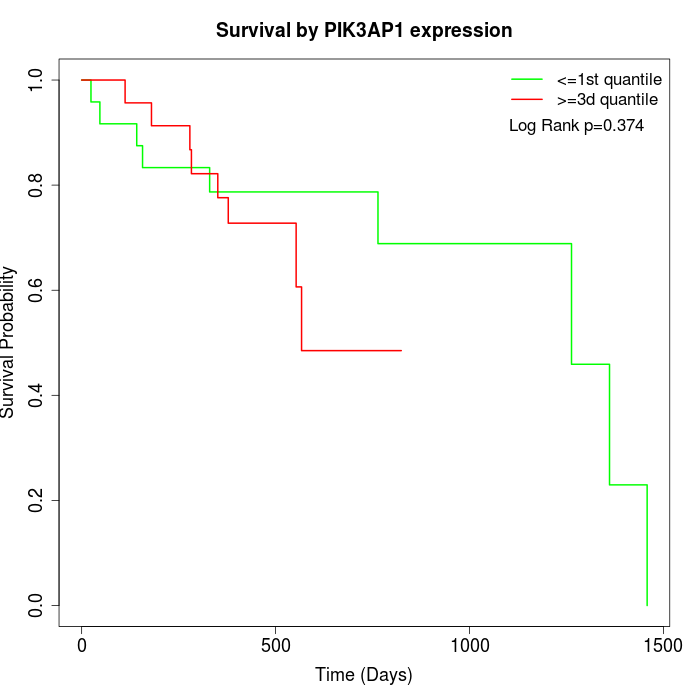 |
| GSE53622 | GSE53624 | TCGA |
Note: Click image to view full size file.
Copy number change of PIK3AP1:
| Dataset | Gene | EntrezID | Gain | Loss | Normal | Detail |
|---|---|---|---|---|---|---|
| GSE15526 | PIK3AP1 | 118788 | 0 | 8 | 22 | |
| GSE20123 | PIK3AP1 | 118788 | 0 | 7 | 23 | |
| GSE43470 | PIK3AP1 | 118788 | 0 | 7 | 36 | |
| GSE46452 | PIK3AP1 | 118788 | 0 | 11 | 48 | |
| GSE47630 | PIK3AP1 | 118788 | 2 | 14 | 24 | |
| GSE54993 | PIK3AP1 | 118788 | 7 | 0 | 63 | |
| GSE54994 | PIK3AP1 | 118788 | 2 | 10 | 41 | |
| GSE60625 | PIK3AP1 | 118788 | 0 | 0 | 11 | |
| GSE74703 | PIK3AP1 | 118788 | 0 | 5 | 31 | |
| GSE74704 | PIK3AP1 | 118788 | 0 | 4 | 16 | |
| TCGA | PIK3AP1 | 118788 | 5 | 28 | 63 |
Total number of gains: 16; Total number of losses: 94; Total Number of normals: 378.
Somatic mutations of PIK3AP1:
Generating mutation plots.
Highly correlated genes for PIK3AP1:
Showing top 20/876 corelated genes with mean PCC>0.5.
| Gene1 | Gene2 | Mean PCC | Num. Datasets | Num. PCC<0 | Num. PCC>0.5 |
|---|---|---|---|---|---|
| PIK3AP1 | LILRB1 | 0.852213 | 4 | 0 | 4 |
| PIK3AP1 | SERPINA1 | 0.808255 | 3 | 0 | 3 |
| PIK3AP1 | CD180 | 0.807095 | 4 | 0 | 4 |
| PIK3AP1 | LAIR1 | 0.789898 | 4 | 0 | 4 |
| PIK3AP1 | FCGR3A | 0.782551 | 3 | 0 | 3 |
| PIK3AP1 | SUCNR1 | 0.782244 | 4 | 0 | 4 |
| PIK3AP1 | LCP2 | 0.778283 | 5 | 0 | 4 |
| PIK3AP1 | GPR34 | 0.772611 | 4 | 0 | 4 |
| PIK3AP1 | MILR1 | 0.76373 | 4 | 0 | 4 |
| PIK3AP1 | THEMIS2 | 0.761388 | 3 | 0 | 3 |
| PIK3AP1 | CD163 | 0.752382 | 5 | 0 | 5 |
| PIK3AP1 | ST8SIA4 | 0.749832 | 5 | 0 | 5 |
| PIK3AP1 | LAIR2 | 0.738173 | 3 | 0 | 3 |
| PIK3AP1 | LRRK1 | 0.731533 | 3 | 0 | 3 |
| PIK3AP1 | TNFSF8 | 0.725422 | 4 | 0 | 4 |
| PIK3AP1 | HLA-DMA | 0.724461 | 4 | 0 | 4 |
| PIK3AP1 | TNFRSF9 | 0.723404 | 3 | 0 | 3 |
| PIK3AP1 | CERKL | 0.72046 | 3 | 0 | 3 |
| PIK3AP1 | GPR65 | 0.720287 | 6 | 0 | 5 |
| PIK3AP1 | PTPN7 | 0.718938 | 4 | 0 | 4 |
For details and further investigation, click here