| Full name: calcitonin receptor like receptor | Alias Symbol: CGRPR|CRLR | ||
| Type: protein-coding gene | Cytoband: 2q32.1 | ||
| Entrez ID: 10203 | HGNC ID: HGNC:16709 | Ensembl Gene: ENSG00000064989 | OMIM ID: 114190 |
| Related drugs: ALCOHOL, CHEMBL756, CLOZAPINE, DAVALINTIDE, ERENUMAB, MK3207, MONOETHANOLAMINE, OLCEGEPANT, RIMEGEPANT, TELCAGEPANT... [more] | |||
CALCRL involved pathways:
| KEGG pathway | Description | View |
|---|---|---|
| hsa04270 | Vascular smooth muscle contraction |
Expression of CALCRL:
| Dataset | Gene | EntrezID | Probe | Log2FC | Adj.pValue | Expression |
|---|---|---|---|---|---|---|
| GSE17351 | CALCRL | 10203 | 206331_at | -0.1741 | 0.8657 | |
| GSE20347 | CALCRL | 10203 | 206331_at | -0.1978 | 0.2242 | |
| GSE23400 | CALCRL | 10203 | 206331_at | 0.0404 | 0.4972 | |
| GSE26886 | CALCRL | 10203 | 206331_at | -0.4454 | 0.1087 | |
| GSE29001 | CALCRL | 10203 | 206331_at | -0.2070 | 0.4333 | |
| GSE38129 | CALCRL | 10203 | 206331_at | -0.1422 | 0.4035 | |
| GSE45670 | CALCRL | 10203 | 206331_at | -0.2291 | 0.5459 | |
| GSE53622 | CALCRL | 10203 | 86915 | -0.3135 | 0.0016 | |
| GSE53624 | CALCRL | 10203 | 86915 | -0.0333 | 0.7123 | |
| GSE63941 | CALCRL | 10203 | 210815_s_at | 1.1879 | 0.2320 | |
| GSE77861 | CALCRL | 10203 | 206331_at | 0.3102 | 0.1540 | |
| GSE97050 | CALCRL | 10203 | A_33_P3306103 | 0.3986 | 0.4131 | |
| SRP007169 | CALCRL | 10203 | RNAseq | 0.1919 | 0.6578 | |
| SRP008496 | CALCRL | 10203 | RNAseq | 0.0926 | 0.7054 | |
| SRP064894 | CALCRL | 10203 | RNAseq | 0.5570 | 0.1267 | |
| SRP133303 | CALCRL | 10203 | RNAseq | -0.3074 | 0.1728 | |
| SRP159526 | CALCRL | 10203 | RNAseq | -0.0860 | 0.8445 | |
| SRP193095 | CALCRL | 10203 | RNAseq | -0.0177 | 0.9295 | |
| SRP219564 | CALCRL | 10203 | RNAseq | 0.1858 | 0.7107 | |
| TCGA | CALCRL | 10203 | RNAseq | -0.1042 | 0.3225 |
Upregulated datasets: 0; Downregulated datasets: 0.
Survival by CALCRL expression:
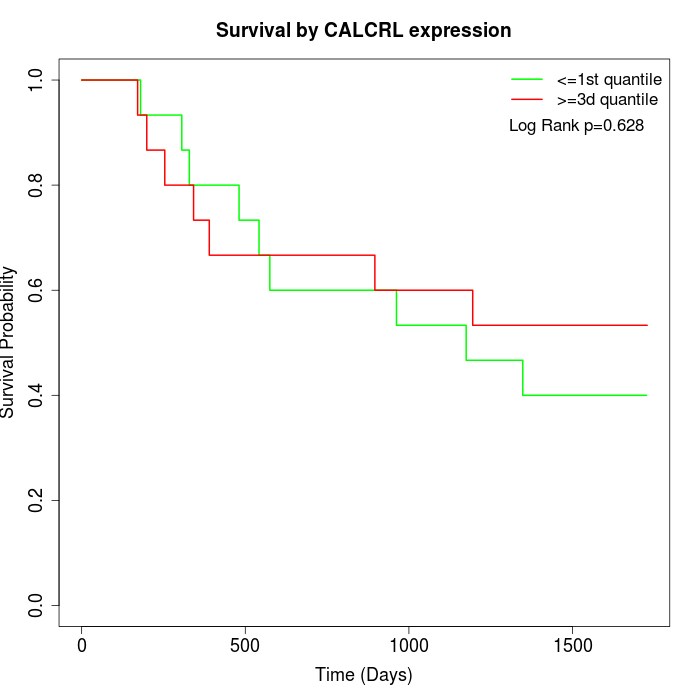 | 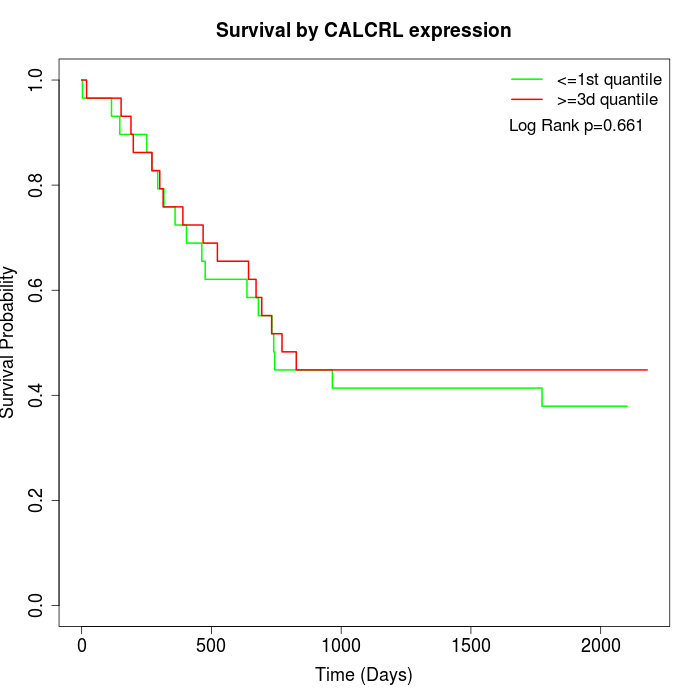 | 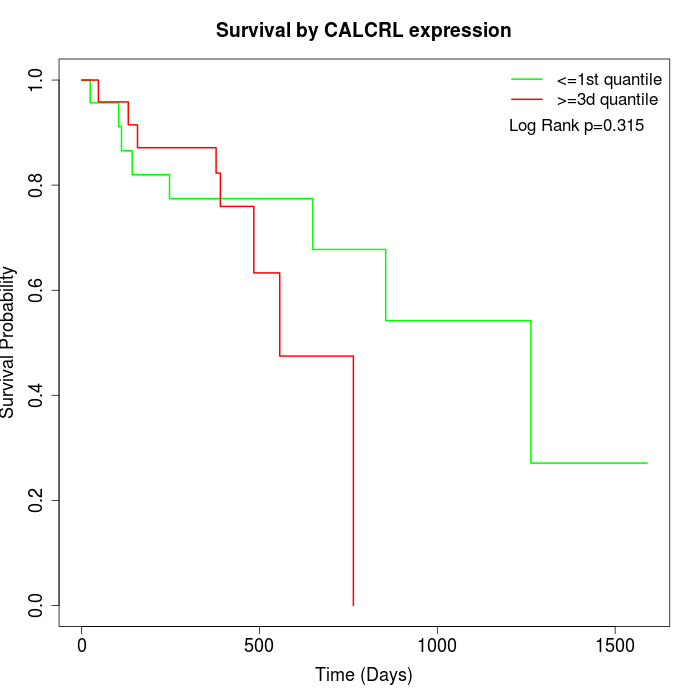 |
| GSE53622 | GSE53624 | TCGA |
Note: Click image to view full size file.
Copy number change of CALCRL:
| Dataset | Gene | EntrezID | Gain | Loss | Normal | Detail |
|---|---|---|---|---|---|---|
| GSE15526 | CALCRL | 10203 | 7 | 1 | 22 | |
| GSE20123 | CALCRL | 10203 | 7 | 1 | 22 | |
| GSE43470 | CALCRL | 10203 | 3 | 1 | 39 | |
| GSE46452 | CALCRL | 10203 | 1 | 4 | 54 | |
| GSE47630 | CALCRL | 10203 | 4 | 5 | 31 | |
| GSE54993 | CALCRL | 10203 | 0 | 5 | 65 | |
| GSE54994 | CALCRL | 10203 | 12 | 6 | 35 | |
| GSE60625 | CALCRL | 10203 | 0 | 3 | 8 | |
| GSE74703 | CALCRL | 10203 | 2 | 1 | 33 | |
| GSE74704 | CALCRL | 10203 | 3 | 1 | 16 | |
| TCGA | CALCRL | 10203 | 24 | 6 | 66 |
Total number of gains: 63; Total number of losses: 34; Total Number of normals: 391.
Somatic mutations of CALCRL:
Generating mutation plots.
Highly correlated genes for CALCRL:
Showing top 20/146 corelated genes with mean PCC>0.5.
| Gene1 | Gene2 | Mean PCC | Num. Datasets | Num. PCC<0 | Num. PCC>0.5 |
|---|---|---|---|---|---|
| CALCRL | SPRED1 | 0.778872 | 3 | 0 | 3 |
| CALCRL | ADSL | 0.763327 | 3 | 0 | 3 |
| CALCRL | ELOVL5 | 0.756902 | 3 | 0 | 3 |
| CALCRL | NAGLU | 0.756164 | 3 | 0 | 3 |
| CALCRL | PSMA5 | 0.747864 | 3 | 0 | 3 |
| CALCRL | MRPL47 | 0.719751 | 3 | 0 | 3 |
| CALCRL | CEP152 | 0.717287 | 3 | 0 | 3 |
| CALCRL | SLC30A7 | 0.712299 | 3 | 0 | 3 |
| CALCRL | NIN | 0.71038 | 3 | 0 | 3 |
| CALCRL | SLC44A1 | 0.707596 | 3 | 0 | 3 |
| CALCRL | CYGB | 0.706053 | 3 | 0 | 3 |
| CALCRL | NUDT21 | 0.705266 | 3 | 0 | 3 |
| CALCRL | SORL1 | 0.704687 | 3 | 0 | 3 |
| CALCRL | ASCC1 | 0.702998 | 4 | 0 | 3 |
| CALCRL | XPOT | 0.701132 | 3 | 0 | 3 |
| CALCRL | MTRF1L | 0.69962 | 3 | 0 | 3 |
| CALCRL | LRRC59 | 0.698197 | 3 | 0 | 3 |
| CALCRL | MFAP1 | 0.69608 | 4 | 0 | 3 |
| CALCRL | MTFMT | 0.694434 | 3 | 0 | 3 |
| CALCRL | FST | 0.694387 | 3 | 0 | 3 |
For details and further investigation, click here